Keywords
Hedge ratio; BGARCH; Dates.
JEL Classification
C1, C15, C32, D4.
Introduction
One of the most important questions in agricultural economic is why producers are not engaged in futures markets to
manage price risk as predicted by theorical and empirical literature [1]. Important question in price risk management
issues is whether market instruments such as future contracts and future markets, can be effectively used to manage
price risk. Transfer of risk is one of the main functions of the futures markets. Risks are transferred to those willing
to bear them, as hedgers reduce their risk by paying a premium to speculators. For agricultural commodities, risk
may occur due to drought, near record production, an increase in demand, a decrease in international production, etc.
Producers usually face different layers of risks, which can be categorized in to three types in general. First, normal
variation in production, which do not require any policy response and should be directly managed by producers as
part of their normal business strategy. Second, catastrophic events, which are infrequent and beyond the capacity of
producers or markets to manage, require government's involvement. To deal with these risks, government usually
launches support programs. Third, market risks. Occur due to the changes in supply and demand, which are beyond
the control of producers skills but they can manage the risks by using market tools. This is where insurance and
future market comes in [1]. The price risks are caused by the change in supply and demand which is beyond
producer's control [9]. With a tendency toward a decline in government support programs like direct subsides
programs, producers are forced to identity these risks and use private risk management strategies such as future
contracts to alleviate losses by themselves [1]. Hedging by the agricultural producers generally involves selling the
commodity futures because producers of the commodity want to lock in a price floor. Simultaneously speculators
and investors looking to lock in a price ceiling are buying the contract. The commodity futures markets thus provide
a means to transfer risk between persons holding the physical commodity (hedgers) and investors speculating in the
market [6].
Dates market status and its price volatility
Dates represents a major role in Iran agricultural economic. Figure 1 shows that the production of dates was
relatively stable over the last 20 years. There was a slight forward line in 2007. In 2010 Iran's dates yield was
63326.4 Hg/Ha. Dates product provides nearby 1.3% of total agricultural export value. In the years 2008, 2009,
2010, dates cash receipts contributed 101783, 55819, 134001 thousand$ from its export. The average revenue from
date's production contributed more than 7206 Billion Rial during 2010. Iran was the second largest date exporters
with 2.8% of the worlds date supply in 2010.
Figure 1: Dates production during 1990-2010
Trade is an important part of Iran's date's demand. According to F.A.O the amount of dates export was about 106760
Tones in 2010. Iran ranked as the second and forth largest dates exporters in the world for the past years. Iran has
been the third largest Dates producers in the world in 2010. Iran's dates export has been fluctuated during 1990-
2010. The maximum amount of dates export has been occurred in 1996. Figure 2 shows dates producers price in
cash markets during 1990-2011. As figure 3 shows price was not stable over this time period. The difference
between the highest price and the lowest price was almost 3354.3 Rials/KG during the past 20 years which shows
that the highest dates producer's price was almost 2.5 times as much as the lowest price there fore date's price has
had risk. Dates producers revenue is generated from the sale of dates. The correlation between dates producer price
(PP) and date production with one lag (Y-1) which is about -0.2 and the correlation between date market margin
(MM) and date production with one lag (Y-1) which is about -0.5 shows that there is fluctuation in the producer's and
wholesaler's income (respectively) so dates price has risk.
Figure 2: Iran's dates producer price during 1990-2011 in constant price 2004=100
Figure 3: Monthly Dates future prices forecasted with different methods
A considerable amount of research has applied the Generalized Autoregressive Conditional Heteroscedasticity
(GARCH) models proposed by Engle [8], Bollerslev [4,5] to estimate time-varying optimal hedge ratios. Di Ai [1]
demonstrates optimal hedge ratios using futures contracts for Ontario and Alberta feedlot for live cattle and feeder
cattle. This study estimated constant optimal hedge ratios using OLS and SUR models. Times varying optimal hedge
ratios were estimated by GARCH models. Results indicated that time varying hedge ratios eliminated more risk than
constant hedge ratios. Waldemar et al [11] determined optimal hedge ratios for soybean farmers in Rondonópolis ,
using the bivariate GARCH BEKK model, which considers the conditional correlations of the prices series, and then
compared the results with the minimum variance model effectiveness. The financial effectiveness of the dynamic
hedge model is superior and can be used by farmers for several decision making purposes. Taufiq Choudhry [6]
investigated the hedging effectiveness of time-varying hedge ratios in the agricultural commodities futures markets
using four different versions of the GARCH models. The GARCH models applied are the standard bivariate
GARCH, the bivariate BEKK GARCH, the bivariate GARCH-X and the bivariate BEKK GARCH-X. Futures data for corn, coffee, wheat, sugar, soybeans, live cattle and hogs are applied. Comparison of the hedging effectiveness is
done for the within sample period (1980–2004), and two out-of-sample periods (2002–2004 and 2003–2004).
Results indicated superior performance of the portfolios based on the GARCH-X model estimated hedge ratio
during all periods. Kumar et al [10] examines hedging effectiveness of futures contract on a financial asset and
commodities in Indian markets. They estimate dynamic and constant hedge ratio for S&P CNX Nifty index futures,
Gold futures and Soybean futures. Various models (OLS, VAR, and VECM) are used to estimate constant hedge
ratio. To estimate dynamic hedge ratios, they use VAR-MGARCH. It is found that in most of the cases, VARMGARCH
model estimates of time varying hedge ratio provide highest variance reduction as compared to hedges
based on constant hedge ratios. Baillie and Myers [2] examined six different commodities using daily data over two
futures contract periods. They estimated Bivariate GARCH models of cash and future prices for six commodities.
The models appear to fit the data well and estimated OHRs vary over time so that the usual assumption of constant
OHRs is inappropriate.
Materials and Methods
Data on Dates comprise monthly observations over the years 1990-2011 namely:
• Producer price in constant price 2004=100 in Rials of I.R Iran
• Wholesale price in constant price 2004=100 in Rials of I.R Iran
• Total Date product in Tones
All of above data are collected from the statistical office of central Bank of the I.R of Iran.
Time-Varying Hedge Ratios and Their Estimation Using BGARCH Models
• The Time-Varying Hedging Rule
Using a mean-variance framework, hedge ratios have been estimated using OLS by regressing the returns from
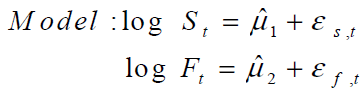
holding a spot contract on returns from holding a futures contract. In a similar context, assuming utility
maximization and efficiency in future markets, the conditional optimal one-period ahead hedge ratio,  , at time
t can be derived as:
, at time
t can be derived as:
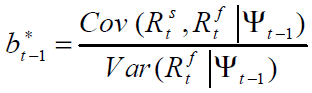 (1)
(1)
Where  and
and denote logarithmic of spot and futures prices from t-1 to t, respectively and
 is the
information set at time t-1. This ratio is similar to the conventional hedge ratio except that the conditional variance
and covariance replace their unconditional counterparts. Because conditional moments can change as the
information set is updated, the hedge ratios also can change through time. [3].
is the
information set at time t-1. This ratio is similar to the conventional hedge ratio except that the conditional variance
and covariance replace their unconditional counterparts. Because conditional moments can change as the
information set is updated, the hedge ratios also can change through time. [3].
The motivation behind using BGARCH model in the context of hedge ratio estimation is that, monthly date's future
and spot prices react to the same information and have none zero covariance conditional of the available information
set.
A natural and widely used model for estimating model 1 is BGARCH model. An alternative to the diagonal vech
parameterization and appropriate bivariate model was tentatively specified as: [2]
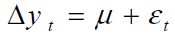
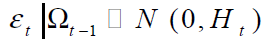 (2)
(2)

Where 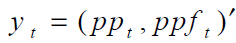 is a (2 × 1) vector containing cash and futures prices, Ht is a (2 × 2)
conditional covariance matrix, C is a (3 × 1) parameter vector, A and B are (3 × 3) parameter matrixes, and
vech is the column stacking operator that stacks the lower triangular portion of a symmetric matrix.
The diagonal vech parameterization involves nine conditional variance parameters.
is a (2 × 1) vector containing cash and futures prices, Ht is a (2 × 2)
conditional covariance matrix, C is a (3 × 1) parameter vector, A and B are (3 × 3) parameter matrixes, and
vech is the column stacking operator that stacks the lower triangular portion of a symmetric matrix.
The diagonal vech parameterization involves nine conditional variance parameters.
Results
Monthly cash (spot) and futures prices of dates are used in the empirical tests. Since dates are storable commodity so
future price for a storable asset is considered equal to the assets cash price plus the assets cost of carry [7]. Because
there are no future markets for dates in Iran, so in this paper, dates future prices is calculated with cost of carry
method and also with forecasting methods (GARCH models and Artificial Neutral network techniques). Then, these
three methods are compared with each other. All the data rage are from 1990:1-2011:12.
At first, Unit root tests for monthly date's producer prices in constant price 2004=100, is performed. Results of ADF
test indicate that the null hypothesis could be rejected for spot price series at 5% significance level. So the producer
price series (PP) and the logarithm of producer price series are stationary.
In the next step, ARCH-LM test is performed on date's spot price. According to AIC and SBC criteria two lags is
accepted for spot price series, which equation is as follow: (standard deviation in parenthesis)
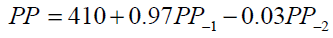
 (3)
(3)
PP is dates cash producer price. If there are ARCH effects left in residuals, the GARCH approach proved to be
appropriate. Table number 1 shows that the null hypothesis could be rejected and ARCH effect is left. There fore
GARCH model is appropriate to be used.
Table1: Results of ARCH-LM test for date's spot producer price model
Ref: research findings
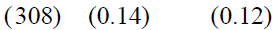
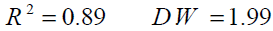
Results of best GARCH (1, 1) is as follow: (standard deviation in parenthesis)
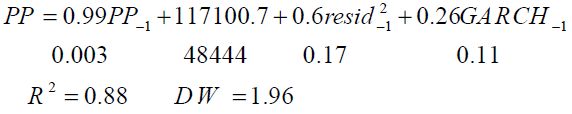 (4)
(4)
After applying GARCH model, future prices series is forecasted using this GARCH model (from equation number
4). More over, future prices series is forecasted with artificial neural network (ANN) approach.
This paper is used Multi-layer Perceptron Neural Network. Five neurons for the hidden layer and one neuron for
output layer were chosen. In the hidden layer, logistic function as activation function and in the output layer, linear
function as activation function was used. Figure number 3 shows the results of future prices forecasted for dates.
After forecasting dates future prices with these three methods, according to minimum variance criteria, the ANN
approach is preferred and outcome.
Table 2: Estimation of BGARCH models with BEKK
Determination of hedge ratios
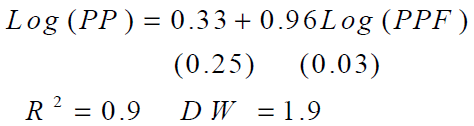
The OLS regression was performed for date's prices. When the regression, 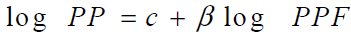 , was run, a trend variable was added for a better results. The coefficient
of β is constant hedge ratio. Figure number 6 represents the OLS estimated constant hedge ratio from the minimum
variance model. It is clear from equation number 16 that β coefficient is positive and significantly different from
zero at 1% level. R2 represents to what extent the variation of spot returns can be explained by futures returns [10].
Combining the optimal hedge ratios and R2 values, the question that how much of the dates product should be
hedged to maximize the risk reduction, can be answered. A date's producer who maintained 96% of dates hedged
could reduce the date's price risk by 90%.
, was run, a trend variable was added for a better results. The coefficient
of β is constant hedge ratio. Figure number 6 represents the OLS estimated constant hedge ratio from the minimum
variance model. It is clear from equation number 16 that β coefficient is positive and significantly different from
zero at 1% level. R2 represents to what extent the variation of spot returns can be explained by futures returns [10].
Combining the optimal hedge ratios and R2 values, the question that how much of the dates product should be
hedged to maximize the risk reduction, can be answered. A date's producer who maintained 96% of dates hedged
could reduce the date's price risk by 90%.
 (5)
(5)
Table number 2 provides the parameter value for the BGARCH- BEKK results to examine the autoregressive
conditional heteroskedasticity and interaction effects that exists for the PP and PPF. The ARCH coefficients are
positive and significant; imply volatility in the log difference of cash price (A11) and future price (A22). Dates
GARCH coefficient (B11, B22) are significantly positive implying GARCH effect. The covariance parameters
indicate a positive and significant interaction between these two prices. The covariance GARCH parameters  , which account for the conditional covariance between cash and futures prices, are positive and significant, imply strong interaction between cash and futures prices. The estimated Bivariate GARCH models with
BEKK parameterization appear to provide a good represent of the data (LL=420). Since the main objective of this
study was to determine the time varying optimal hedge ratios so this study used three above models ( BEKKDiagonal
VECH- CCC) to determine BGARCH hedge ratios. According to minimum standard deviation hedge
ratios and also to Hedge effectiveness criteria the BEKK is outperform. Figure number 4 shows time varying
optimal hedge ratios for dates from BEKK model. The average of the BGARCH optimal hedge ratios was 0.7 which
was slightly lower than the OLS constant optimal hedge ratio (0.96) during 1990-2011. Most of the movement of the
time varying hedge ratios is confined below the constant minimum variance hedge ratio.
, which account for the conditional covariance between cash and futures prices, are positive and significant, imply strong interaction between cash and futures prices. The estimated Bivariate GARCH models with
BEKK parameterization appear to provide a good represent of the data (LL=420). Since the main objective of this
study was to determine the time varying optimal hedge ratios so this study used three above models ( BEKKDiagonal
VECH- CCC) to determine BGARCH hedge ratios. According to minimum standard deviation hedge
ratios and also to Hedge effectiveness criteria the BEKK is outperform. Figure number 4 shows time varying
optimal hedge ratios for dates from BEKK model. The average of the BGARCH optimal hedge ratios was 0.7 which
was slightly lower than the OLS constant optimal hedge ratio (0.96) during 1990-2011. Most of the movement of the
time varying hedge ratios is confined below the constant minimum variance hedge ratio.
Figure 4: optimal hedge ratios from BGARCH model and OLS
(Time varying hedge ratios V.s constant hedge ratios)
Conclusion
In Iran the date's production represents a major role in agricultural economic. The date's producer price has been
fluctuating over the last few decades. So these fluctuations effect on farmer's motivation and these fluctuations are
forced farmers not to produce. In addition, Iranian government has gradually decreased the (in) direct subsidy paid
to producers and forced the producers to take the primary responsibility for managing market risks. So this study
examined for managing dates price risk by using futures markets. This study focuses on dates and studied hedging
prices for dates. Since, there is not a future market for dates yet, so, we forecasted dates futures price with three
different methods. Then, under the mean variance frame work, optimal hedge ratios were estimated. BGARCH
models were applied to estimate time varying hedge ratios for dates during 1990-2011. This method permits the
hedge ratios to be based on conditional information. Results of hedge effectiveness show that the BGARCH hedge
ratios perform better at reducing the variance of the portfolio return for dates in comparison to OLS hedge ratio.
Hedging dates by using the BGARCH hedge ratio in future market was recommended based on the results of this
study. Since there was not a big difference in risk reduction between using constant and time varying hedge ratios,
both hedge ratios could achieve more than 70% price risk reduction, and dynamic hedge ratios is appeal.
One of the main functions of the futures market is to provide a hedging (risk transfer) mechanism. It is also a welldocumented
claim in the futures market literature that the optimal hedge ratio should be time-varying and not
constant. So results of this paper show that the BGARCH hedge ratios outperform OLS. In general hedging dates in
future markets is a good way and could eliminate producer's price risk to 80%.
References
- Ai D. 2012. A thesis presented to the University of Guelph. Food agricultural and resource economics.
- Baillie R. T, Myer, R. J.1991. Journal of Applied Econometrics, 6, 109-124.
- Bera A. K, Garcia, P, Roh JS. 1997. OFOR paper. NO. 97-06.
- Bollerslev, T. 1990. Review of Economics and Statistics, 72, 498-505.
- Bollerlev, T. 1986. 31, 307-327.
- Choudhry, T. 2009. International Review of Financial Analysis 18. 58–65.
- Covey, T, Bessler D. 1995. Journal of Empirical Finance, 1995, 103−115.
- Engle, RF. 1982. Inflation. Econometrica, 50, 987-1007.
- Garier K. 2005. Final report to the competition Bureau. George Morris Centre.
- Kumar B, Priyanka, S, Ajay P. 2010. Available at SSRN: https://ssrn.com/abstract=1206555 or https://dx.doi.org/10.2139/ssrn. working paper series.
- Waldemar Antônio da Rocha, Carlos Eduardo Caldarelli, Clei Machado Rocha, João Gomes Martines-Filho.2010. Organizações Rurais & Agroindustriais, Lavras, v. 12, n. 1, p. 34-45.


