Keywords
Fatty liver; NAFLD; VLDL; Nonalcoholic steatohepatitis; Insulin resistance
Introduction
In children, fatty liver disease usually occurs secondary to metabolic causes such as obesity and insulin-resistant diabetes and is thought to affect at least 10% of children [1]. Fatty liver disease can be broadly categorized into alcoholic and nonalcoholic fatty liver disease [2]. Nonalcoholic Fatty Liver Disease (NAFLD) is the major chronic liver disease in the pediatric population [3]. NAFLD includes a broad spectrum of abnormalities (inflammation, fibrosis and cirrhosis), ranging from accumulation of fat (steatosis) to Nonalcoholic Steatohepatitis (NASH) [4].
The worldwide prevalence of NAFL Dis with a median of 20% in the general population is based on a variety of assessment methods [5]. Most efforts to determine the prevalence of fatty liver in children have been restricted to studies using indirect measures such as blood tests or ultrasound to predict a histologic outcome [6].
To determine the real prevalence of NAFLD in children may be difficult because the liver biopsy, the “gold standard” for diagnosis, has not been performed in large epidemiologic studies; the present studies use the Alanine aminotransferase (ALT) and Aspartate aminotransferase (AST)serum concentration or the abdominal ultrasound, but their specificity and predictive values are uncertain [7].
NAFLD can be thought of as the hepatic manifestation of the metabolic syndrome (linking obesity, Insulin Resistance (IR), hypertension and hyperlipidemia). The pathogenesis of the condition is still incompletely understood [8].
The ‘two hit hypothesis’ proposed in 1998 consists of a first hit of liver fat accumulation which is caused by an imbalance in uptake and synthesis of hepatic lipids on the one hand and export and oxidation on the other in the context of IR [9]. The steatotic liver is then thought to be more vulnerable to a ‘second hit’. This may be oxidative stress, small-bowel bacterial overgrowth [10,11].
It seems that two hypotheses can be proposed to explain the occurrence of hepatic steatosis in type 1 diabetes in humans. First, atypical lipoprotein ratios and/or function could be responsible for an insufficient triglyceride secretion from the liver by VLDL. Second, transcription factors of hepatic metabolism such as Carbohydrate Responsive Element-Binding Protein (ChREBP) and Sterol Regulatory Element-Binding Protein 1c (SREBP-1c) are activated by hyperglycemia and promote hepatic lipogenesis.
In addition, we may consider a third hypothesis, namely that hepatic steatosis may develop secondary to hyperglycemia in type 1 diabetes patients by glucose being transported from the blood into the liver by Glucose Transporter 2 (GLUT2), with the excess of sugar being converted into fat. This effect may be further amplified by hepatic up regulation of GLUT2 that occurs during hyperglycemia and hypo insulinemia (characterizing precisely the conditions in type 1 diabetes), mediated by SREBP-1c [12], as described above.
Clinical Features
The NAFLD onset is insidious [7]. Clinically, most pediatric patients with NAFLD/NASH have nonspecific symptoms. Some complain of fatigue, malaise, or vague abdominal pain (42%-59% of cases), especially in the right upper quadrant, which has been associated with the more progressive form of NASH [13].
The most common clinical presentation is the incidental finding of isolated hepatomegaly or slightly elevated serum aminotransferases in a child who may have
• Excess weight or obesity
• Type 1 or 2 diabetes mellitus
• Acanthosisnigricans is associated with insulin resistance [14]
• Previous chemotherapy survivors of childhood neoplasia are a well-recognized problem, particularly following acute lymphoblastic leukemia [15,16]
Diagnosis
The diagnosis of NASH, which is characterized by necroinflammation, ballooning degeneration, and fibrosis, is essentially based on histological examination by liver biopsy. The liver biopsy removes only about 1/50,000th of the liver which is a painful and invasive procedure with potentially lifethreatening complications [17,18] and the use of liver biopsy is limited in the pediatric population because of its invasiveness and the fact that the histologic features of pediatric NASH are somewhat different from those of adult NASH [19,20] new non-invasive approaches for diagnosis of fibrosis in liver which includes:
Laboratory tests
Laboratory tests that are routinely included in the evaluation of patients with suspected NAFLD include a serum panel of liver tests (ALT), (AST), albumin, cholesterol, triglyceride, complete blood count and glycosylated hemoglobin (HbA1c). These measurements must be combined with evaluation of BMI and with other information such as the patient's gender and lifestyle. Elevated serum ALT and AST levels are the primary abnormality seen in patients with NAFLD and tend to be higher in patients with NASH as compared with NAFLD [21].
Imaging techniques
Which include Ultrasonography (US) that is currently the preferred method for screening asymptomatic patients with elevated liver enzymes and suspected NAFLD. Ultrasonography findings of fatty liver include hepatomegaly, diffuse increase in echogenicity of the liver parenchyma, and vascular blunting [22]. The other noninvasive technique is Computed Tomography (CT scan) [23]. However, CT not recommended for the pediatric population due to ionizing radiation and cannot assess concurrent inflammation and fibrosis.
The third technique is Magnetic Resonance Imaging (MRI) which is highly accurate and useful for identifying and quantifying hepatic steatosis safely, without radiation hazard [24]. The disadvantages include high costs, [25]. The last imaging technique is Magnetic Resonance Elastography (MRE), which measures liver damage more accurately than do other imaging modalities. Because MRE is a new test, its availability is limited elsewhere [26].
Non-invasive biomarkers
Biomarker of hepatic inflammation (C - reactive protein (CRP), Tumor Necrosis Factor (TNF)-α, interleukin-6 and adipocytokine). Biomarker of oxidative stress [these biomarkers include lipid peroxidation products, antioxidant glutathione, or protein oxidation products].
Biomarker of hepatic Fibrosis (Biomarkers of hepatic fibrosis or fibrogenesis have been suggested, including Tumor Growth Factor-β (TGF-β), hyaluronic acid, laminin, type IV collagen, and other extracellular matrix components, although there are some limitations to these molecules) [27].
Biomarker of hepatocyte apoptosis Cytokeratin-18 (CK-18) levels were significantly higher inchildren with suspected NAFLD than in controls, indicatingthat CK-18 is the best single independent predictor of NAFLD in children [28].
Non-invasive fibrosis score
Body mass index AST/ALT Ratio Diabetes (BARD) score that is a simple scoring system designed to identify NAFLD patients with a low-risk of advanced disease. It combines three variables of BMI, AST/ALT Ratio (AAR), and the presence of diabetes into a weighted sum (BMI >28=1 point, AAR of >0.8=2 points, DM=1 point), to generate a score from 0 to 4 [29].
• AST-Platelet Ratio Index (APRI), which includes AST and platelet count, has primarily been used to predict hepatic fibrosis in various chronic liver diseases in adults and children [30,31].
• FIB-4 score, which involves age, AST, ALT levels, and platelet count, In NAFLD, FIB-4 has demonstrated similar results to the AAR where, using a cut-off of 1.3, its sensitivity 85%, specificity 65% and Negative Predictive Value (NPV) of 95% were demonstrated for the diagnosis of advanced fibrosis [32].
• NAFLD Fibrosis Score (NFS) is based on six readily available variables (age, BMI, hyperglycemia, platelet count, albumin, AST/ALT ratio) and it is calculated using the published formula. In a meta-analysis of 13 studies consisting of3,064 patients [33], NFS has an Area Under the Receiver Operating Characteristic curve (AUROC) of 0.85 for predicting advanced fibrosis (i.e., bridging fibrosis or cirrhosis) and a score <-1.455 had 90% sensitivity and 60% specificity to exclude advanced fibrosis whereas a score > 0.676 had 67% sensitivity and 97% specificity to identify the presence of advanced fibrosis [34].
Management
Patients With steatosis should be given lifestyle advice and discharged. Patients with NASH need multidisciplinary input to support implementation of lifestyle changes and medical treatment.
Lifestyle management
All patients with fatty liver disease without decompensation should be strongly recommended to modify their diet by reducing sugar and fat intake [35].
Medical management
Few pharmacological treatments have been investigated in children: Ursodeoxycholic acid. A small randomized controlled trial of ursodeoxycholic acid (10.0-12.5 mg/kg/day [36]. Vitamin E (400-1200 IU/day orally) [37]. In a small randomized controlledtrial in children, vitamin E treatment showed some improvement in serum aminotransferases, but no change in apparent steatosis [38].Probiotics a new treatment strategy that was recently, proposed for treatment of NAFLD. [39]. However, to confirm these results, further larger randomized studies are still needed.
Patient and Methods
A prospective study that enrolled 50 patients with type 1 diabetes, who were recruited from the diabetic clinic in children welfare teaching hospital/medical city, from 1st of June 2016 to 1st of December 2016. Exclusion criteria were, children less than 3years old, obese children and those with history of diabetes less than two years, history of parenteral nutrition at time of gathering information, use of drugs known to induce steatosis (e.g. valproate, amiodarone or prednisone) or to affect body weight and carbohydrate metabolism (e.g. episodic lactic acidosis and failure to thrive) and children with liver diseases unrelated to diabetes. All patients' data were collected and reviewed including age ranging from 3 to 18- year-old, weight and height, BMI was calculated using the formula: weight (in kilograms)/height (in meters²).
Malnourished were diagnosed when BMI was (< 18.5 kg/m²) and normal when BMI was (18.5-25 kg/m²), duration of diabetes [2-14] year, treatment included type and amount of insulin in units (morning and night dose) then the mean of insulin units was taken. The diagnosis of pediatric NAFLD was made by routine noninvasive evaluation:
• Biochemical parameters which include lipid profile (serum cholesterol, serum triglyceride) liver enzymes (AST,ALT), serum albumin which was done by using MINDRAY Chemistry Analyzer (BS-200), hematological parameter which include serum platelet by using Automated Hematology Celtac Coulter Counter in the laboratory unit of children welfare teaching hospital and the level of glycosylated hemoglobin (HbA1C) was determined to all patients by taking the mean of three readings during the last year and considered with poor glycemic control if >10% regardless of patient's age.
• Imaging test by using ultrasound which is the most commonly used imaging modality because it is relatively inexpensive, widely available that was done by the same radiologist using Ultrasound machine (Philips, U.S.A.) equipped with a 3.5-MHz and 7-MHz probes (C5-2,L12-3 Philips) to detect hepatomegaly.
• Noninvasive formula of liver fibrosis include NAFLD Fibrosis Score (NFS) according to the NFS formula=-1.675 + 0.037- age (years) +0.094-BMI (kg/m) +1.13 × IFG/diabetes (yes=1, no=0) +0.99 × AST/ALT ratio-0.013 × platelet count (×10/ l)-0.66 × albumin (g/dl). According to Angulo et al. a score lower than -1.455 (low cutoff) excludes advanced fibrosis, whereas a score higher than 0.676 (high cutoff) predicts advanced fibrosis. Scores between these values are defined as indeterminate [38].
Results
A total of 50 patients with type 1 diabetes mellitus were included in the study where twenty (40%) are male and thirty (60%) are female.
The mean age of the study group was 10.5 ± 4.011 years with range (3-18) year. Out of the 50 diabetic children 13 (26.0%) of them with hepatomegaly that was detected by U/S and the rest 37 (74.0%) were with normal liver size, according to age distribution (23.1%) of patients with hepatomegaly between 5 to 9 years old while (76.9%) of them ≥ 10 years old, while those with normal liver size (13.5%) < 5years old and (29.7%) 5-9 years old and (56.8%) ≥ 10 years old, there was no statistical significance regarding age and gender.
The mean BMI ± SD of patients with hepatomegaly were (17.46 ± 3.07), 8 (61.5%) patients with hepatomegaly were malnourished while 5 (38.5%) of them had normal BMI the thirty seven patients with normal liver size, 25 of them malnourished while 12 of them were normal (17.41 ± 2.85) (mean ± SD of BMI).
Regarding the duration of diabetes 5 (38.5%) patients with hepatomegaly have diabetes less than 5years and 6 (46.2%) patients have diabetes from 5 to 9 years while 2 (15.4%) of them ≥ 10 years with mean ± SD of duration (5.6 ± 3.4), the thirty seven patients with normal liver 19 (51.4%) with diabetes less than 5 years, twelve (32.4%) with diabetes from 5 to 9 years, six (16.2%) of them ≥ 10 years in duration with mean ± SD of duration (5.2 ± 3.8). There was no statistical significance regarding the BMI and duration of illness with the ultrasound findings.
There was a statistical significance between serum triglyceride level and ultrasound findings in which 69.2% of patients with hepatomegaly had had hypertriglyceridemia while 86.5% of patients with normal liver size had normal triglyceride level (P-value=0.0001).
There was also significant difference in the fibrosis score between patient, (73.0%)of those with normal liver size had no fibrosis (F0---F2) and (77%) of patients with hepatomegaly had intermediate fibrosis and presence of fibrosis that included (F2---F3, F3---F4) (P-value=0.0001) (Table 1).
| Liver by abdominal US |
P-value |
| Distribution of Patients |
Hepatomegaly (n=13) |
Normal (n=37) |
| No |
% |
No |
% |
| Serum triglyceride level Group of fibrosis score |
TG>148 |
9 |
69.2 |
5 |
13.5 |
0.0001* |
| Normal |
4 |
30.8 |
32 |
86.5 |
| F0---F2 |
3 |
23 |
27 |
73 |
0.0001* |
| F2---F3 |
5 |
38.5 |
10 |
27 |
| F3---F4 |
5 |
38.5 |
- |
- |
| F0-F2 “<-1.455; Absence of significant fibrosis” |
| F2-F3 “≤-1.455-≤0.675; Intermediate” |
| F3-F4 “>0.675; Presence of fibrosis” |
| *Significant difference between proportions using Pearson Chi-square test at 0.05 level |
| P-value=0.0001 |
Table 1: Distribution of patients according to serum triglyceride level and the fibrosis score.
There was statistical significance regarding the NFS between patients with mild/no fibrosis and presence of fibrosis (Pvalue< 0.00001) (Table 2).
| Score |
Overall (N=50) |
Fibrosis stage 0-2 (N=45) |
Fibrosis stage 3-4 (N=5) |
P-Value |
| NFS |
-1.5 ± 1.3 |
-1.8 ± 0.9 |
1.4 ± 0.5 |
<0.00001 |
Table 2: Comparison between patients with fibrosis stages 0-2 and 3-4.
According to U/S findings we have two groups of patients and in each one three categories according to fibrosis score, regarding the patients with hepatomegaly (23%) represent the false negative value while (27%) of patients with normal liver represent the false positive value.
The differences in the AST level between patients with hepatomegaly and those who had not; revealed that serum AST were higher among patients with hepatomegaly (Pvalue= 0.001) while no significant differences were shown regarding ALT level and serum albumin (Table 3).
| Liver by abdominal US |
P-value |
| Comparison |
Hepatomegaly (n=13) |
Normal (n=37) |
| AST (IU/L) |
31.54 ± 16.34 (7-59) |
17.62 ± 11.36 (7-55) |
0.001* |
| ALT (IU/L) |
18.08 ± 12.72 (4-43) |
12.97 ± 8.39 (4-35) |
0.108 |
| Albumin (g/L) |
38.38 ± 6.28 (30-49) |
40.51 ± 5.40 (29-51) |
0.247 |
| Data were presented as Mean ± SD (Range) |
| *Significant difference between two independent means using Students-t-test at 0.05 level. |
Table 3 Comparison of the mean serum AST, ALT and albumin level for the patients with hepatomegaly and those without.
The differences in platelets count revealed that their values were lower in patients with hepatomegaly than those with normal liver size (P-value=0.007), also there was statistical significance between ultrasound finding and serum cholesterol level, serum triglyceride level (P-value=0.001), (Pvalue= 0.0001) respectively (Table 4).
| Comparison |
Liver by abdominal US |
P-value |
| hepatomegaly (n=13) |
Normal (n=37) |
| Platelates (x109/L) |
148.9 ± 63.5 (77-276) |
207.4 ± 64.8 (65-343) |
0.007* |
| Serum Cholesterol (mg/dL) |
206.2 ± 48.7 (140-280) |
153.1 ± 44.2 (90-245) |
0.001* |
| Serum Triglycerides (mg/dL) |
160.6 ± 60.5 (69-265) |
96.7 ± 37.3 (30-198) |
0.0001* |
| Data were presented as Mean ± SD (Range) |
| *Significant difference between two independent means using Students-t-test at 0.05 level. |
Table 4: Comparison of the mean platelets, serum cholesterol and triglycerides level for the patients with hepatomegaly and those without.
Clinical and biochemical data of the examined patients put in correlation with NAFLD fibrosis score as we see there was strong correlation between AST level for all included patients and fibrosis score (P-value=0.0001) and ALT level showed significant correlation with fibrosis score in patients with hepatomegaly (P-value=0.039),also there was strong correlation between platelets count, serum cholesterol and serum triglyceride and fibrosis score in all included patients (Pvalue= 0.0001, P-value=0.0001, P-value=0.0001) respectively,while there was no significant correlation between fibrosis score and albumin, HbA1C and amount of insulin units (Tables 5 and 6).
| Variables |
Liver by abdominal US |
P-value |
| Hepatomegaly (n=13) |
Normal (n=37) |
|
| Insulin morning units |
20.69 ± 7.78 (8-34) |
18.54 ± 9.69 (4-40) |
0.474 |
| Insulin evening units |
10.15 ± 3.67 (4-14) |
9.54 ± 5.37 (2-24) |
0.705 |
| Insulin total units |
30.85 ± 10.95 (12-48) |
28.08 ± 14.56 (8-60) |
0.536 |
| HbA1C (%) |
10.69 ± 1.41 (8-12.6) |
8.24 ± 2.04 (4.8-12.6) |
0.021* |
| Data were presented as Mean ± SD (Range) |
| *Significant difference between two independent means using Students-t-test at 0.05 level. |
Table 5: Comparison of Serum HbA1C and Insulin Units for the Included Patients between those who have Hepatomegaly and those who have not.
| Fibrosis score |
| Data |
Total (n=50) |
Hepatomegaly (n=13) |
Normal (n=37) |
| Age (years) |
r |
0.157 |
0.109 |
0.148 |
| P |
0.276 |
0.723 |
0.381 |
| BMI (Kg/m2) |
r |
0.178 |
0.116 |
0.274 |
| P |
0.216 |
0.705 |
0.101 |
| Duration of illness (years) |
r |
-0.137 |
-0.5 |
-0.029 |
| P |
0.342 |
0.082 |
0.863 |
| AST (IU/L) |
r |
0.527** |
0.292 |
0.502** |
| P |
0.0001 |
0.333 |
0.002 |
| ALT (IU/L) |
r |
-0.13 |
-0.578* |
-0.012 |
| P |
0.367 |
0.039 |
0.946 |
| Albumin (g/L) |
r |
-0.152 |
0.189 |
-0.288 |
| P |
0.292 |
0.536 |
0.084 |
| Platelates (x109/L) |
r |
-0.527** |
-0.394 |
-0.479** |
| P |
0.0001 |
0.182 |
0.003 |
| Serum Cholesterol (mg/dL) |
r |
0.601** |
0.516 |
0.490** |
| P |
0.0001 |
0.071 |
0.002 |
| Serum Triglycerides (mg/dL) |
r |
0.510** |
0.358 |
0.304 |
| P |
0.0001 |
0.23 |
0.067 |
| Insulin morning units |
r |
0.054 |
-0.218 |
0.119 |
| P |
0.707 |
0.475 |
0.484 |
| Insulin evening units |
r |
0.095 |
-0.155 |
0.195 |
| P |
0.511 |
0.612 |
0.247 |
| Insulin total units |
r |
0.071 |
-0.207 |
0.151 |
| P |
0.623 |
0.498 |
0.373 |
| HbA1C (%) |
r |
0.211 |
0.205 |
0.191 |
| P |
0.14 |
0.502 |
0.258 |
| *Correlation is significant at the 0.05 level. **Correlation is highly significant at the 0.01 level |
Table 6 Correlation between Clinical and Biochemical Data of All Patients with NAFLD Fibrosis Score.
In order to determine the diagnostic accuracy of the scoring system, ROC curve was used (Figures 1 and 2), NFS (AUROC 0.74).
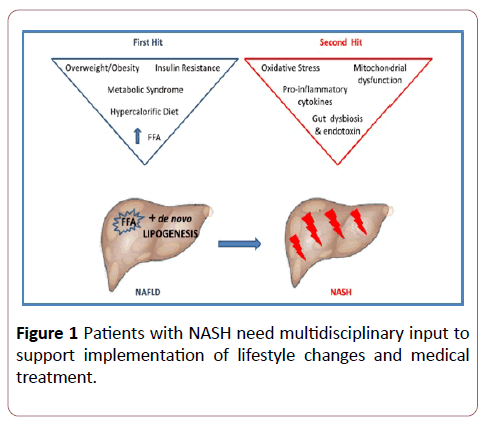
Figure 1: Patients with NASH need multidisciplinary input to support implementation of lifestyle changes and medical treatment.
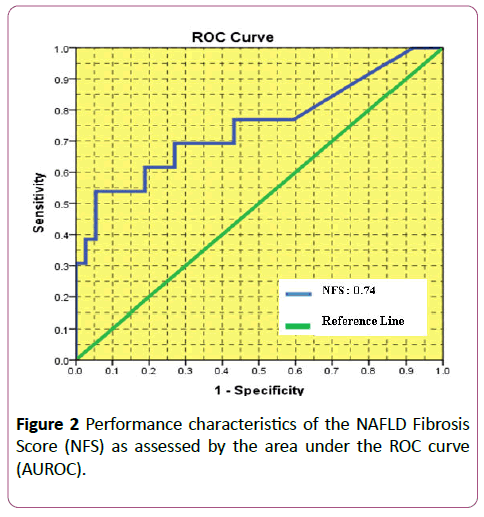
Figure 2: Performance characteristics of the NAFLD Fibrosis Score (NFS) as assessed by the area under the ROC curve (AUROC).
Discussion
Diabetic children and adolescents are frequently referred to the pediatric gastroenterologist for consultation when hepatic abnormality is detected clinically or by laboratory investigations or imaging.
The major finding of this study was the increased prevalence of abnormal liver finding (hepatomegaly) on ultrasound in children with type 1 diabetes (26%) while in Al-Hussaini et al. (Indian study of 106 children with type 1 diabetes) [40],he reported 10% of abnormal liver finding and in El-Karaksy et al. (a larger study of 692 Egyptian children with type 1 diabetes) [41] reported a prevalence of 4.5% of abnormal liver finding, this could be attributed to poorer glycemic control of the included patients in this study; 64% have HbA1C >10% as compared to 24% in El-Karaksy et al. study and 61.3% in Al- Hussaini et al. study.
Regarding the patients with hepatomegaly (69.2%) of them were females while (30.8%) were males so the female to male ratio 2:1, while in El-Karaksy et al. it was equal between the two sexes.
About the mean value of HbA1C of the included patients in this study with hepatomegaly (10.69 ± 1.41) while for those with normal ultrasound finding (8.24 ± 2.04) with significant difference (P-value=0.021) while in El-Karaksy et al. study the mean value of HbA1C in diabetic patients with hepatic abnormality was (8.1 ± 1.2) while for those without hepatic abnormality was (7.6 ± 1.7) without significant difference (PJournal value=0.05), and in Al-Hussaini et al. study in which the mean value of HbA1C of patients with hepatic abnormality (12.14) while for those with normal liver (10.7) without significant difference (P-value=0.09) this indicates the poor glycemic control of diabetic patients in this study leading to the increased prevalence of hepatic abnormality.
Serum triglyceride level mean value for diabetic children with hepatomegaly (160.6 ± 60.5) while for normal one was (96.7 ± 37.3) with significant difference (P-value=0.0001) that was non compatible with Al-Hussaini et al. study in which mean value of serum triglyceride level for patients with hepatic abnormality was (1.1 mmol/L which is equal to 19.8 mg/dl) while for normal one (0.98 mmol/L which is equal to 17.6 mg/dl) with no significant difference (P-value=0.76).
Serum cholesterol level of the diabetic patients with hepatomegaly mean value was (206.2 ± 48.7) while for the ones with no hepatomegaly was (153.1 ± 44.2) with significant difference (P-value=0.001) that was incompatible with Al- Hussaini et al. study in which no significant difference (Pvalue= 0.41) regarding their mean value in patients with hepatic abnormality (4.3 mmol/L which is equal to 77.4 mg/dl) while for diabetic children without hepatic abnormality (4.1 mmol/L which is equal to 73.8 mg/dl).
Elevated plasma level of the liver enzyme (ALT) is an indicator of hepatocellular injury and have been used as a marker for NAFLD [42], although other researchers have not found any clear correlation between NAFLD and abnormal ALT concentrations Adams et al. Mofrad et al. [43,44]. Two studies, relating serum ALT to type 1 diabetes, found elevated levels of the enzyme in 10-35% of type 1 diabetes patients, respectively West et al. Leeds et al. [45,46] in comparison to this study ALT level showed no statistical significant (P-value=0.1) this may be attributed to that mainly ALT level increased in patients with obesity, type 2 diabetes who were not included in this study and usually metabolic derangement affect AST more than ALT.
The serum AST level was correlated with the stage of fibrosis and could be used to distinguish significance from no or mild fibrosis Carter-Kent et al. [47],that was compatible with this study where the AST was considered a good predictor of fibrosis in children and adolescents based on statistical significance (P-value=0.001).
The mean value of score for patients with no/mild fibrosis (F0-F2, F2-F3) (-1.8 ± 0.9) while for those (F3-F4) (1.4 ± 0.5) so there was a significant difference (P-value ≤ 0.00001) which was incompatible with Alkhouri et al. [48] in which the NFS scores were not that significant (P-value=0.14) but compatible with Mcpherson et al. [49] in which NFS scores showed significant differences (P-value ≤ 0.001), By observing the low cutoff point (score below -1.455) with sensitivity, specificity, NPV, PPV, (69.2%, 73%, 87%, 55%) respectively in combination with abdominal U/S finding the fibrosis could be excluded with high accuracy (NPV87%), while for the results that were obtained from U/S finding and high cutoff point (greater than 0.676) with sensitivity, specificity, NPV, PPV (30.8%, 97.3, 80%, 80%) respectively, the presence of fibrosis could be diagnosed with high accuracy (PPV 80%) which did not agree with Arora and Sharma [50] regarding NPV of low cutoff point and PPV of high cutoff point while in considering PPV of low cutoff point and NPV of high cutoff point was compatible.
In order to detect diagnostic accuracy of scoring system ROC curve was used, AUROC 0.74 (CI95%, 0.57-0.92) which was compatible with Alkhouri et al. (AUROC 0.60). Two noninvasive approaches have been used successfully in this study to detect fatty liver disease, abdominal ultrasound and NFS scoring formula with accuracy rate 74% which lowers the necessity for liver biopsy. Still those children with false negative and false positive result have to be subjected to liver biopsy to make clear liver involvement interpretation.
For liver biopsy is not any more acceptable, taking in consideration its being invasive procedure for diagnosis especially in pediatric age group in addition to it's being a triggering factor to medico legal and triple conflict in our society now a day because of the poor law enforcement.
Conclusions
From the above study the following conclusions can be drawn:
1. For the diabetologist, fatty liver disease is important at both ends of its spectrum, it is an early warning sign of future consequence of diabetes mellitus in the form of progression to liver fibrosis, cirrhosis and failure.
2. The study clarified that the prevalence of fatty liver disease in diabetic patients was 10% depending on abdominal ultrasound, lipid profile, liver enzymes and NAFLD fibrosis scoring formula.
3. The optimum sensitivity and specificity of abdominal ultrasound and NAFLD Fibrosis Scoring formula for detecting fatty liver disease were (76.9%, 73%) respectively with positive predictive value (50%) and negative predictive value (90%) so the noninvasive measures more accurate in exclusion of fatty liver disease.
4. By using the ROC curve the performance of NAFLD Fibrosis Scoring formula was (0.74) that making it effective in detecting fatty liver disease.
References
- Plesec T, Cruise M (2016) Liver pathology. Pediatric gastrointestinal and liver disease, 5th edn. Elsevier, Philadelphia, USA, p: 798.
- Kleiner DE, Brunt EM, Van Natta M, Behling C, Contos MJ, et al. (2005) Design and validation of a histological scoring system for nonalcoholic fatty liver disease. Hepatology 41: 1313-1321.
- Molleston JP, Schwimmer JB, Yates KP, Murray KF, Cummings OW, et al. (2014) Histological abnormalities in children with nonalcoholic Fatty liver disease and normal or mildly elevated alanine aminotransferase levels. J Pediatr 164: 707-713.
- Alisi A, Manco M, Vania A, Nobili V (2009) Pediatric nonalcoholic fatty liver disease in 2009. J Pediatr 155: 469-474.
- Vernon G, Baranova A, Younossi ZM (2011) Systematic review: The epidemiology and natural history of non-alcoholic fatty liver disease and nonalcoholic steatohepatitis in adults. Aliment Pharmacol Ther 34: 274-285.
- Schwimmer JB (2007) Nonalcoholic fatty liver disease. In: Suchy FJ, Sokol RJ, Balistreri WF (eds). Liver Disease in Children, 3rd edn. Cambridge University Press, USA 830-831.
- Kistler KD, Molleston J, Unalp A, Abrams SWH, Behling C, et al. (2010) Symptoms and quality of life in obese children and adolescents with non-alcoholic fatty liver disease. Aliment Pharmacol Ther 31: 396-406.
- Fitzpatrck E (2016) Nonalcoholic fatty liver disease. In: Guandalini S, Dhawan A, Branski D (eds). Textbook of Pediatric Gastroenterology, Hepatology and Nutrition, 1st edn. Springer International Publishing, Switzerland, p: 755.
- Lipshutz GS, Patel S, Hiatt JR, Yersiz H, Farmer DG, et al. (2006) Portocaval hemi-transposition in pediatric liver transplant recipients: A single-center experience. Liver Transpl 12:1097-1103.
- Bekkera J, Ploemb S, De Jong JP (2009) Early hepatic artery thrombosis after liver transplantation: A systematic review of the incidence, outcome and risk factors. Am J Transplant 9: 746-757.
- Sieders E, Peeters PM, Ten Vergert EM, De Jong KP, Porte RJ, et al. (2000) Early vascular complications after pediatricliver transplantation. Liver Transplant 6: 326-332.
- Im SS, Kang SY, Kim SY, Kim HI, Kim JW, et al. (2005) Glucose-stimulated upregulation of GLUT2 gene is mediated by sterol response element-binding protein- 1c in the hepatocytes. Diabetes 54: 1684-1691.
- Patton HM, Lavine JE, Van Natta ML, Schwimmer JB, Kleiner D, et al. (2008) Clinical correlates of histopathology in pediatric nonalcoholic steatohepatitis. Gastroenterology 135: 1961-1971.
- Roberts E (2008) Nonalcoholic steatosis. In: Kelly D (ed). Diseases of the liver and biliary system in children, 3rd ed. John Wiley & Sons, Ltd. Publication, UK, pp: 257-258.
- Talvensaari KK, Knip M, Lanning P, Lanning M (1996) Clinical characteristics and factors affecting growth in long-term survivors of cancer. Med Pediatr Oncol 26: 166-172.
- Talvensaari KK, Lanning M, Tapanainen P, Knip M (1996) Longterm survivors of childhood cancer have an increased risk of section 6 liver disease in older children 266 manifesting the metabolic syndrome. J Clin Endocrinol Metab 81: 3051-3055.
- Costera L, Negre I, Samii K, Buffet C (1999) Pain experienced during percutaneous liver biopsy. Hepatology 30: 1529-1530.
- Piccinino F, Sagnelli E, Pasquale G, Giusti G (1986) Complications following percutaneous liver biopsy. A multicentre retrospective study on 68,276 biopsies. J Hepatol 2: 165-173.
- Schwimmer JB, Behling C, Newbury R, Deutsch R, Nievergelt C, et al. (2005) Histopathology of pediatric nonalcoholic fatty liver disease. Hepatology 42: 641-649.
- Ko JS, Yoon JM, Yang HR, Myung JK, Kim HR, et al. (2009) Clinical and histological features of nonalcoholic fatty liver disease in children. Dig Dis Sci 54: 2225-2230.
- Mikako O, Hirofumi N (2012) Diagnosis and evaluation of nonalcoholic fatty liver disease. Experimental Diabetes Res 2: 1.
- Sanyal AJ (2002) American gastroenterological association. AGA technical review on nonalcoholic fatty liver disease. Gastroenterology 123: 1705-1725.
- Park SE, Yang HR, Chang JY, Ko JS, Seo JK, et al. (2005) Correlation of body mass index, body fat distribution, amino tranferases and computed tomography in obese children with fatty liver. Korean J Pediatr 48: 276-283.
- Pacifico L, Di Martino M, Catalano C, Panebianco V, Bezzi M, et al. (2011) T1-weighted dual-echo MRI for fat quantification in pediatric nonalcoholic fatty liver disease. World J Gastroenterol 17: 3012-3019.
- Charatcharoenwitthaya P, Lindor KD (2007) Role of radiologic modalities in the management of non-alcoholic steatohepatitis. Clin Liver Dis 11: 37-54.
- Mayo Clinic (2016) Physicians specializing in digestive diseases, nonalcoholic fatty liver disease and nonalcoholic steatohepatitis- diagnosis 2: 1.
- Wieckowska A, McCullough AJ, Feldstein AE (2007) Non-invasive diagnosis and monitoring of nonalcoholic steatohepatitis: Present and future. Hepatology 46: 582-589.
- Vos MB, Barve S, Joshi BS, Carew JD, Whitington PF, et al. (2008) Cytokeratin 18, a marker of cell death, is increased in children with suspected nonalcoholic fatty liver disease. J Pediatr Gastroenterol Nutr 47: 481-485.
- Osakabe K, Ichino N, Nishikawa T, Sugiyama H, Kato M, et al. (2011) Reduction of liver stiffness by antiviral therapy in chronic hepatitis B. J Gastroenterol 46: 1324-1334.
- Loaeza Del Castillo A, Paz PF, Oviedo CE, Sanchez AF, Vargas VF (2008) AST to platelet ratio index (APRI) for the noninvasive evaluation of liver fibrosis. Ann Hepatol 7: 350-357.
- McGoogan KE, Smith PB, Choi SS, Berman W, Jhaveri R (2010) Performance of the AST-to-platelet ratio index as a noninvasive marker of fibrosis in pediatric patients with chronic viral hepatitis. J Pediatr Gastroenterol Nutr 50: 344-346.
- Shah AG, Lydecker A, Murray K, Tetri BN, Contos MJ, et al. (2009) Comparison of noninvasive markers of fibrosis in patients with nonalcoholic fatty liver disease. Clin Gastroenterol Hepatol 7: 1104-1112.
- Musso G, Gambino R, Cassader M, Pagano G (2011) Meta-analysis: Natural history of non-alcoholic fatty liver disease (NAFLD) and diagnostic accuracy of non-invasive tests for liver disease severity. Annals of Medicine 43: 617-649.
- Angulo P, Hui JM, Marchesini G, Bugianesi E, George J, et al. (2007) The NAFLD fibrosis score: A noninvasive system that identifies liver fibrosis in patients with NAFLD. Hepatology 45: 846-854.
- Joshi D, Keane GBA (2015) Hepatology at a glance, 1st edn. Wiley J & Sons Ltd., UK, p: 61.
- Vajro P, Franzese A, Valerio G, Iannucci MP, Aragione N (2000) Lackof efficacy of ursodeoxycholic acid for the treatment of liver abnormalities in obese children. J Pediatr 136: 739-743.
- Lavine JE (2000) Vitamin E treatment of nonalcoholic steatohepatitisin children: A pilot study. J Pediatr 136: 734-738.
- Vajro P, Mandato C, Franzese A, Ciccimarra E, Lucariello S, et al. Vitamin E treatment in pediatric obesity-related liver disease: A randomized study. J Pediatr Gastroenterol Nutr 38: 48-55.
- Schrezenmeir J, De Vrese M (2001) Probiotics, prebiotics, and synbiotics-approaching a definition. AmJ ClinNutr 73: 361S-364S.
- Al-Hussaini AA, Sulaiman NM, Alzahrani MD, Alenizi AS, Khan M (2012) Prevalence of hepatopathy in type 1 diabetic children. BMC Pediatrics 12: 5-6.
- Elâ€ÂÂÂÂKaraksy HM, Anwar G, Esmat G, Mansour S, Sabry M, et al. (2010) Prevalence of hepatic abnormalities in a cohort of Egyptian children with type 1 diabetes mellitus. Pediatric Diabetes 11: 467.
- Schindhelm RK, Diamant M, Dekker JM, Tushuizen ME, Teerlink T, et al. (2006) Alanine aminotransferase as a marker of non-alcoholic fatty liver disease in relation to type 2 diabetes mellitus and cardiovascular disease. Diabetes Metab Res Rev 22: 437-443.
- Adams LA, Angulo P, Lindor KD (2005) Non-alcoholic fatty liver disease. Can Med Assoc J 172: 899-905.
- Mofrad P, Contos MJ, Haquw M, Sargeant C, FisherRA, et al. (2003) Clinical and histologic spectrum of nonalcoholic fatty liver disease associated with normal ALT values. Hepatology 37: 1286-1292.
- West J, Brousil J, Gazis A, Jackson L, Mansell P, et al. (2006) Elevated serum alanine transaminase in patients with type 1 or type 2 diabetes mellitus. J Assoc Phys 99: 871-876.
- Leeds JS, Forman EM, Morely S, Scott AR, TesfayeS, et al. (2009) Abnormal liver function tests in patients with type 1 diabetes mellitus: Prevalence, clinical correlations and underlying pathologies. Diabet Med 26: 1235-1241.
- Carterâ€ÂÂÂÂKent C, Yerian LM, Brunt EM, Angulo P, Kohli R, et al. (2009) Nonalcoholic steatohepatitis in children: A multicenter clinicopathological study. Hepatology 50: 1113-1120.
- Alkhouri N, Mansoor S, Giammaria P, Liccardo D, Lopez D, et al. (2014) The development of the pediatric NAFLD fibrosis score (PNFS) to Predict the presence of advanced fibrosis in children with nonalcoholic fatty liver disease. Public Library of Science One 9: 4.
- McPherson S, Stewart SF, Henderson E, Burt AD, Day CP (2010) Simple non-invasive fibrosis scoring systems can reliably exclude advanced fibrosis in patients with non-alcoholic fatty liver disease. Gut 59: 1265-1269.
- Arora A, Sharma P (2012) Non-invasive diagnosis of fibrosis in non-alcoholic fatty liver disease. J Clin Experimental Hepatol 2:145-155.