Keywords
Genetic similarity; RAPD; ISSR; Ventilago maderaspatana Geartn
Introduction
Ventilago maderaspatana Geartn is a woody liana belonging to family Rhamnaceae. It is distributed in the forest of low elevations in Southern Greece, India, Indonesia, Myanmar, and Sri Lanka. Commonly called as Red creeper [1,2]. It shows the presence of vathraquinonesphyscion, emodin, islandiein, xanthrorin, and xanthorin-5-methyl ether, isofuranonaphthaquinones, ventilone-c, Ventiloquinones E,G,J eleuthrin, enantiopure 1,3-dimethyl pyranonappthoquinones
[3,4]. For the first time Kawade et,al. [5] isolated and characterized a novel coumarin derivative from the stem bark. It is used as Carminative, stomachic, antioxidant, antiinflammatory, hepatoprotective and anti-bacterial agent [6]. In combination with Fillicium decipiens, it shows beneficial effects on diabetic nephropathy via improved antioxidant status, reduces oxidative stress and reduces hyper glycemic conditions [7]. Ethanolic and hydroethanolic extracts of roots showed significant antioxidant activities [2]. A study of ethanolic extracts against bilateral carotid artery occlusion induced a stroke in rats showed protective effects in global cerebral ischemia as evident from the reduction in behavioral score and neural damage [6]. The whole plant of V. maderaspatana showed a high degree of antibacterial activity against Proteus vulgaris [8].
Plant genetic resources are among the most essential of the world’s natural resources. However, plant genetic resource conservation had greater attention [9]. Plant tissue culture is recognized as one of the key areas of Biotechnology because of its potential use to regenerate elite and conserve valuable plant genetic resources [10]. During micropropagation, it is very important to maintain genetic integrity with regard to the mother plant. In this regard, the somaclonal variation has been reported at different levels (morphological, cytological, cytochemical, biochemical, and molecular) in micropropagated plants. Because of the long life cycles in woody plants, the somaclonal variation has the major economic consequences [11]. Numerous scientific studies conducted showed that tissue cultured induced mutation has been detected in all species studied. Tissue culture-induced mutation like point mutation, chromosome rearrangements, DNA methylation, and histone modifications were observed [10-12]. Therefore, it is important to study the genetic similarity to determine what to conserve, of what type of genotype is needed to be conserved and it is also the fundamental importance for efficient plant breeding programs [9,13].
The similarity is a quantitative term that defines the degree of sequence match between two compared sequences [14]. The degree of genetic similarity can be analyzed by comparing the gene sequence of regenerated plants with mother plant, within the species or between species. To analyze the genetic similarity PCR based DNA markers like Random Amplified Polymorphic DNA (RAPD) and Inter-Simple Sequence Repeats (ISSR) were adopted. These have been the most employed techniques basing on genomic DNA analysis, among the various molecular techniques developed. By using simple random (RAPD) and microsatellite (SSR) sequence of primers’ construction. These techniques allow amplifying characteristic for genotypes of DNA fragments required. These techniques make possible to characterize genotypes regardless of plant physiological stage or examined tissues and their result is independent of environmental conditions. Among other advantages, the short time required obtaining results and highly informative nature was noted and these techniques were proved to be cheaper and more effective in the studies of genetic similarity and diversity of many species [10,15,16]. RAPD has been successfully used to study the relationship between plant species and within the species [17]. It has a very high genomic abundance and randomly distributes throughout the genome. While ISSR is a powerful, rapid, simple technique which requires only low quantities of template DNA (5-50 ng/reaction) [17,18]. Among the numerous molecular markers available to study plant fidelity RAPD and ISSR are cost-effective and require a low amount of DNA. They were successfully used in the studies of genetic similarity/fidelity in many plant species like Potato, Olive, Robinia pseudacaccia, Populus tremuloides, Pinus pinea, Zingiber rubens etc [15].
Our present study is conducted to analyze the genetic similarity between the micro-propagated plants in comparison with the mother plant of Ventilago maderaspatana using PCR based DNA markers like RAPD and ISSR
Methods
DNA extraction
Among the hundreds of successfully micro propagated and reintroduced plants of V. maderaspatana, 14-tagged regenerated plants were selected randomly for screening their genetic integrity. All these plants were derived from a single mother plant. Total DNA was extracted from fresh, young leaves of field-grown plants using the modified CTAB method described by Doyle and Doyle (1990) and Gawel and Jarret (1991) [19,20]. Quality and quantity of DNA were inspected by both gel electrophoresis and spectrometric assays using UV-Visible Double Beam PC Scanning spectrophotometer (LABOMED Inc. USA).
Selection of ISSR and RAPD primers and polymerase chain reaction amplification
A total of 30 ISSR primers and 25 RAPD primers were initially tested using the donor plant DNA (in two replicates) as a template to screen for suitable primers. Each reaction was done in a total volume of 20 μL containing, 2.0 μl 1X Assay buffer [10 mM Tris-HCl (pH 9.0), 1.5 mM MgCl2, 50 mM KCl and 0.01 % geletin], 0.2 μM primer, 200 μM of each dNTP, 1.5 Unit of Taq DNA polymerase and 50 ng genomic DNA. DNA amplifications were performed in Thermocycler, UNO II (Biometra, Germany), programmed for initial denaturation of 3 min at 94°C, followed by 40 cycles for 1 min at 94°C for denaturation, 1 min at the annealing temperature, 2 min at 72°C for extension step. The final extension step was done for 10 min at 72°C and the reactions were kept at 4°C. The annealing temperature depended on the primers used.
The ISSR and RAPD-PCR amplification products were analyzed by electrophoresis in 2 % (w/v) agarose (Amersham) with 1X TBE buffer (Tris-Borate-EDTA buffer) stained with Ethidium bromide (10mg/ml). The amplified products were visualized and photographed under UV Transilluminator and documented using Bioprofile Image Analysis System (Vilber Lourmat, France). In all cases, λ DNA/EcoR I -Hind III Double digest (Bangalore Genei, India) was used as molecular size marker. All the reactions were repeated twice to check reproducibility.
Amplified DNA bands scoring
Amplified DNA bands were scored with all the selected ISSR and RAPD primers (Tables 1 and 2), and only clear and reproducible bands in the size range of 200 bp to 2.1 kb were scored. The bands were transformed into a binary character matrix, “1” for the presence and “0” for the absence of a band, at a particular position. Pairwise distance matrices were computed based on the Jaccard’s coefficient of similarity [21].
| S no |
Primers |
Sequence |
Size(bp) |
Tm=°C |
Number of Bands |
Total |
| Polymorphic |
Monomorphic |
| 1 |
ISSR02 |
CTCTCTCTCTCTCTCTAC |
2027-200 |
40 |
2 |
3 |
5 |
| 2 |
ISSR03 |
CTCTCTCTCTCTCTCTGC |
2027-200 |
40 |
3 |
3 |
6 |
| 3 |
ISSR04 |
CACACACACAAC |
3530-200 |
45 |
1 |
6 |
7 |
| 4 |
ISSR05 |
CACACACACAGT |
831-200 |
45 |
0 |
4 |
4 |
| 5 |
ISSR06 |
CACACACACAAG |
1375-200 |
45 |
1 |
2 |
3 |
| 6 |
ISSR07 |
CACACACACAGC |
1375-200 |
45 |
0 |
6 |
6 |
| 7 |
ISSR10 |
GAGAGAGAGAGACC |
947-200 |
48 |
0 |
4 |
4 |
| 8 |
ISSR12 |
CACCACCACGC |
3530-200 |
45 |
5 |
6 |
13 |
| 9 |
ISSR13 |
GAGGAGGAGGC |
4268-564 |
45 |
0 |
5 |
5 |
| 10 |
ISSR15 |
GTGGTGGTGGC |
1584-564 |
48 |
2 |
3 |
5 |
| 11 |
ISSR16 |
GAGAGAGAGAGAGAGAGAT |
2027-831 |
48 |
3 |
3 |
6 |
| 12 |
ISSR21 |
GATAGATAGATAGATA |
1584-1375 |
40 |
0 |
1 |
1 |
| 13 |
ISSR22 |
CCTACCTACCTACCTA |
1375-947 |
40 |
0 |
1 |
1 |
| 14 |
ISSR01/w3 |
ACACACACACACACACC |
1584-200 |
52 |
0 |
5 |
5 |
| 15 |
ISSR02/w4 |
ACACACACACACACACG |
1375-200 |
46 |
0 |
4 |
4 |
| 16 |
ISSR04/w7 |
GGGTGGGGTGGGGTG |
1904-200 |
50 |
0 |
3 |
3 |
| 17 |
ISSR05/w8 |
CTCTCTCTCTCTCTCTG |
1904-200 |
42 |
6 |
2 |
8 |
| 18 |
ISSR06/w9 |
CACACACACACACACAG |
1375-564 |
42 |
3 |
4 |
7 |
| 19 |
ISSR07/w11 |
TCTCTCTCTCTCTCTCA |
2027-564 |
40 |
0 |
2 |
2 |
| 20 |
ISSR009/30 |
GGAGAGGAGAGGAGA |
1584-947 |
36 |
0 |
2 |
2 |
| 21 |
ISSR10/15 |
CCCGTGTGTGTGTGT |
2027-831 |
40 |
0 |
2 |
2 |
| 22 |
ISSR11/20 |
CCAGTGGTGGTGGTG |
1584-347 |
36 |
0 |
1 |
1 |
| |
Total |
|
|
Total |
26 |
72 |
98 |
Table 1: Primers employed, sequence and ISSR markers obtained from regenerated plants from adventitious shoot buds of a single mother donor plant of Ventilago maderaspatana.
| S no |
Primers |
Sequence |
Size(bp) |
Tm=oC |
Number of Bands |
Total |
| Polymorphic |
Monomorphic |
| 1 |
RAPD-18 |
CCAGATGCAC |
3530-200 |
39.6 |
9 |
8 |
17 |
| 2 |
OPA-04 |
AATCGGGCTG |
4973-831 |
39.3 |
0 |
12 |
12 |
| 3 |
OPA-11 |
CAATCGCCGT |
1904-200 |
40.8 |
8 |
10 |
18 |
| 4 |
OPA-14 |
CTCGTGCTGG |
2027-564 |
35.9 |
7 |
5 |
12 |
| 5 |
OPA-20 |
GTTGCGATCC |
1904-200 |
34.2 |
4 |
3 |
7 |
| 6 |
OPC-01 |
TTCGAGCCAG |
1584-200 |
35.8 |
3 |
4 |
7 |
| 7 |
OPC-02 |
GTGAGGCGTC |
1375-200 |
33.4 |
1 |
4 |
5 |
| 8 |
OPC-04 |
CCGCATCTAC |
2027-200 |
30 |
6 |
4 |
10 |
| 9 |
OPC-05 |
GATGACCGCC |
3530-564 |
38.8 |
5 |
6 |
11 |
| 10 |
OPC-07 |
GTCCCGACGA |
2027-564 |
39.3 |
3 |
4 |
7 |
| 11 |
OPC-08 |
TGGACCGGTG |
1904-564 |
40.7 |
5 |
8 |
13 |
| 12 |
OPD-07 |
TTGGCACGGG |
2027-564 |
46.5 |
5 |
4 |
9 |
| 13 |
OPD-16 |
AGGGCGTAAG |
1904-564 |
34.2 |
2 |
4 |
6 |
| 14 |
OPM-12 |
CACAGACACC |
3530-200 |
21.4 |
3 |
8 |
11 |
| 15 |
OPM-16 |
GTAACCAGCC |
1904-564 |
28.4 |
0 |
6 |
6 |
| 16 |
OPM-20 |
AGGTCTTGGG |
2027-564 |
31.8 |
0 |
7 |
7 |
| 17 |
OPN-03 |
GGTACTCCCC |
3530-564 |
30.9 |
0 |
6 |
6 |
| 18 |
OPN-04 |
GACCGACCCA |
2027-200 |
38.9 |
2 |
6 |
8 |
| 19 |
OPN-06 |
GAGACGCACA |
1375-564 |
30 |
0 |
4 |
4 |
| 20 |
OPN-09 |
TGCCGGCTTG |
1375-200 |
47.2 |
4 |
8 |
12 |
| 21 |
OPN-10 |
ACAACTGGGG |
1375-200 |
32.9 |
1 |
5 |
6 |
| |
TOTAL |
|
|
|
68 |
126 |
194 |
Table 2: Primers employed, sequence and RAPD markers obtained from regenerated plants from adventitious shoot buds of a single mother donor plant of Ventilago maderaspatana.
Data analysis
Data analysis was performed using the NTSYS-pc version 2.02a computer program package [22]. Dendrograms were constructed with the unweighted pair group method with arithmetic averaging (UPGMA) method [23]. In addition, the data sets were subjected to Principal Coordinated Analysis using the NTSYS-pc software [22]. Jaccard similarity coefficients were estimated by the similarity for qualitative data (SIMQUAL) function and aligned using the double center (DCENTER) option. Eigenvectors (EIGEN) was calculated from the transformed matrix using the square root scaling (SQRT-LAMDA) option, and finally, a two-dimensional model was displayed.
Results
Inter-simple sequence repeats
Data of ISSR amplification products generated by PCR amplification using 30 primers screened with donor plant DNA template (replicated), 22 were found to generate highly reproducible patterns with multiple discrete bands in V. madrasapatana. Indeed, all these 22 primers were found to generate identical banding patterns in two independent amplifications that were performed for all samples. The detailed information regarding the selected ISSR primers, their optimal annealing temperature (Tm), bands scored (BS), polymorphic bands (PB) for each primer, size range of the amplified bands (SR) and percentage of polymorphic bands (PPB), were summarized in Table 1. Thirteen of the 22 primers (59.1%) produced complete monomorphic patterns, while each of the rest 09 primers generated polymorphic bands (40.9%) at least in one of 15 individuals relative to the donor plant. 22 primers responded by giving resizing to total 98 bands of which 72 monomorphic bands (73.47%) and 26 polymorphic bands (26.53) classes ranging from 200 bp to 21.226 bp in size. The number of bands per each primer varied from 1 to 11 with an average of 4.5 bands per primer. The changed banding patterns included both losses of original bands and appearance of novel bands, which occurred at more or less equal frequency (Figure 1).
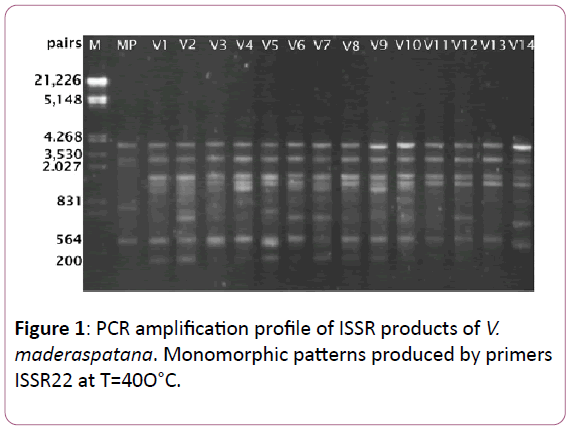
Figure 1: PCR amplification profile of ISSR products of V. maderaspatana. Monomorphic patterns produced by primers ISSR22 at T=40O°C.
The ISSR data was used to calculate genetic similarity among the 15 individuals (14 regenerated and 1 mother plants) in a pair wise manner. The similarity coefficient among the plants ranged from 0.856 to 1.000 with a mean of 0.945. A dendrogram, generated by cluster analysis using the UPGMA method based on Jaccard’s coefficient [24] indicated that the genetic similarity of 93% (Figure 2).
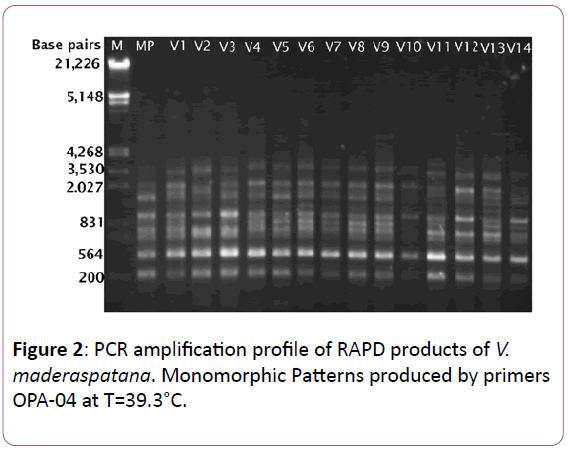
Figure 2: PCR amplification profile of RAPD products of V. maderaspatana. Monomorphic Patterns produced by primers OPA-04 at T=39.3°C.
Random amplified polymorphic DNA
RAPD analysis on two independent extractions of DNA of each of the 14 randomly tagged individuals from micropropagated plants, along with the donor plants of V. madrasapatana with each of the 25 selected primers. Of these 25 primers initially screened, 21 primers were found to generate identical banding patterns in two independent amplifications that were performed for all samples. The selected 14 plants showed no discernible difference from the donor plant in general morphology under field conditions. A total of 194 clear and reproducible bands ranging from 200 bp to 21,226 bp in size were scored. Corresponding to an average of 5.24 bands per primer, which gives 68 (35.05%) of the 194 bands were polymorphic and one twenty-six (64.94%) of the 194 bands were monomorphic among the 20 individuals (Table 2).
The RAPD data was used to calculate genetic similarity among the 15 individuals (14 regenerated and 1 mother plants) in a pair wise manner. The similarity coefficient among the plants ranged from 0.835 to 0.1 with a mean of 0.9175. A dendrogram, generated by cluster analysis using the UPGMA method based on Jaccard’s coefficient (Jaccard 1908) indicated that the genetic similarity of 91%.
Study using dendrograms
A dendrogram generated by cluster analysis using the UPGMA methods on Jaccard’s coefficient [24] indicated the genetic similarity. The dendrogram cluster analysis of V. madrasapatana with UPGMA using genetic distances was carried out. Fourteen micro propagated plants and the mother plant formed a single cluster at an estimated genetic distance of 0.07. Ten micropropagated plants (14,11,12,10,9,5,4,3,2 and 1) together with the mother plant (15) showed complete similarity. Plants 6 and 7 showed a high degree of similarity with mother plant, while two plants (13 and 8) were the least similar. The cluster diagrams of the genotypes are shown in Figure 3.
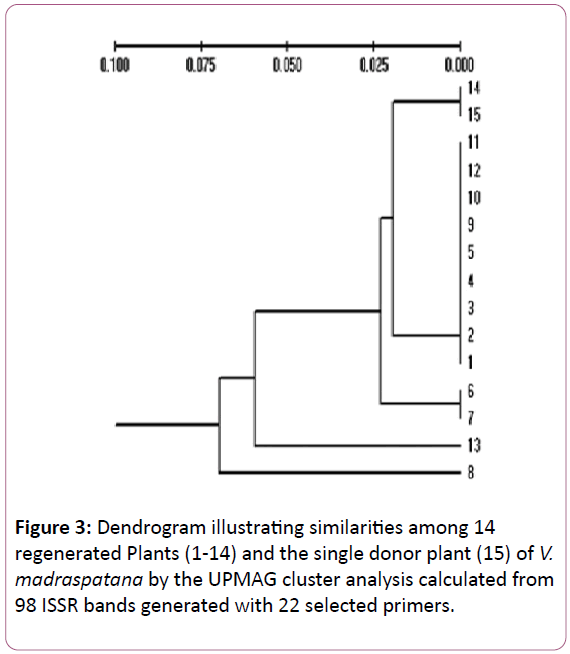
Figure 3: Dendrogram illustrating similarities among 14 regenerated Plants (1-14) and the single donor plant (15) of V. madraspatana by the UPMAG cluster analysis calculated from 98 ISSR bands generated with 22 selected primers.
Discussion
A variety of morphological, cytological and biochemical (by using secondary metabolites) methods are now available for the analysis of variation in the micro propagated plants. These methods are time-consuming and require a large amount of plant material. Moreover, the inertness of the welldifferentiated apical or bud meristems to a limited or no variation and production of true-to-type plants are well documented [25]. Molecular tools are more reliable than phenotypic observations for evaluating variations [26]. Thus suggesting a visual phenotypic evaluation may not be sufficient for characterizing the in vitro plants. Techniques like RAPD and ISSR makes it possible to characterize genotypes regardless of plant physiological stage of examining tissues and their result is independent of environmental conditions [16]. They are often chosen to perform these studies considering their advantages like easy to use, cheap, requiring no previous sequence information and most of the studies show more genetic stability [15,27].
In the present study, RAPD and ISSR markers showed very remarkable results. Of the two types of markers used RAPD primers showed the highest reproducible bands i.e, 194 for 21 primes with an average of 9.24 amplicons/primer. While 22 ISSR primers showed only 98 reproducible bands with an average of 4.45 amplicons/primer. Among the 194 reproducible bands produced by RAPD primers, 126 were monomorphic bands which account for 64.94% and 68 bands were polymorphic which accounts for 35.05%. A total of 72 monomorphic bands and 26 polymorphic bands observed in the case of ISSR primers which accounts for 73.47% and 26.53% respectively. But, among the 21 RAPD primes studied only 05 primers produced complete monomorphic patterns and remaining 16 primers produced polymorphic bands. In the case of 22 ISSR primers, 13 primers produced complete monomorphic bands and 9 primers produced polymorphic bands. In comparison, 22 ISSR primers and 21 RAPD primers they produced 59.1% and 23.8% monomorphic bands and 40.9% and 76.2% polymorphic bands respectively. A similar case was observed in the genetic diversity study of sweet potato landraces, where RAPD markers produced 96.7% polymorphic bands which are comparatively higher than the polymorphic bands produced by ISSR markers i.e., 92.4% [27]. This study contradicts with the earlier reports of genetic studies in case of Morus alba [28], Dioscorea spp. [29] and in the studies of genetic similarity among Strawberry cultivars [30] and among Ocimum spp. where polymorphic bands produced by ISSR primers were more than the RAPD primers. Such a high variation in the number of fragments produced by these arbitrary primers could be attributed to the differences in the binding sites throughout the genome of the genotypes included [31]. The small genetic variation in DNA observed by ISSR analysis may be due to various factors such as the in vitro process and its duration, auxin-to-cytokinin concentration and their ratio (hormonal balance), other nutritional conditions and in vitro stress, all of which are known to induce somaclonal variations. Regenerated systems from organized meristems, such as auxiliary branching, is considered to be the most reliable methods of micropropagation, as they are thought to be resistant to genetic variation induced by tissue culture procedure. Several reports confirm the genetic integrity and uniformity among regenerated plants in Brasica oleracea var. botrytis [26] and strawberry [32].
Conclusion
In general, plants regenerated through shoot tip culture from and somatic embryogenesis from the call of a single seed were morphologically the same. Molecular tools such as PCR based RAPD and ISSR marker techniques are more reliable than phenotypic observation for studying the genetic variation. In this study, even though RAPD and ISSR markers differ in their banding pattern and in the numbers of bans produced, the data analyzed using NTSYS-pc showed that micro propagated plants exhibit maximum similarity with their mother plant.
Acknowledgment
The authors of this paper are thankful to the Head of the Department, Department of Botany, Government Science College, Hassan, Karnataka, India for the support and the technical staff who provided insight and expertise that greatly assisted the research.
References
- Kawde AB, Batra RJ, Weginwar RG, Akkewar DM, Gond GS, et al. (2014) Preliminary phytochemical screening and bioevaluatuion studies of stem bark of ventilago madersapatana garten. Int J Res Pharm Chem 4: 74-82.
- Periyasamy K, Kaliyaperumal S (2016) Ethnobotanical, phytochemical and pharmceutical studies of medicinal plant, Ventilago maderaspatana gaertn (red creeper): a review. Int J Curr Pharm Res 8: 16-18.
- Ravindra KN, Thoyajaksha, Narayanappa M, Sharanappa P (2013) Study of endophytic fungal community from bark of Ventilago madrasapatna gaertn. Int J Pharm Bio Sci 4: 309-316.
- Sanobar S, Sandhya S, Vinod KR, Banji D, Rao KNV, et al. (2010) Pharmacognostic studies on the leaf of Ventilago maderaspatana Graetn. International Journal Of Pharmaceutical And Clinical Research 2: 51-53.
- Kawade AB, Weginwar RG, Akkewar DM, Ramadevi V, Gond GS, et al. (2015) Isolation and characterization of a novel compound from antibiotic and antioxidant fraction from extract of stem bark of Ventilago maderaspatana (garten). IJSRP 5: 1-5.
- Sindhura S, Eswaraiah MC (2014) Evaluation of stroke preventive effect of ethanolic extract of Ventilago madrasaspatana gaertn against bilateral carotid artery occlusion (bcao) induced stroke in rats. Int Res J Pharm App Sci 4: 1-6.
- Sasikala C, Ssudhakar Y (2015) Effect of compounds isolated from Filicium decipiens and Ventilago madraspatana against diabetic nephropathy in streptozotocin induced diabetic rats. IJPER 49: 146-151.
- Lincy MP, Daffodil ED, Esakki DP, Mohan VR (2013) Pharmacochemical characterization and antibacterial activity of Ventilago maderaspatana Gaertn. International Journal of Advances in Pharmaceutical Sciences 4: 578-586.
- Rao VR, Hodgkin T (2002) Genetic diversity and conservation and utilization of plant genetic resources. Plant Cell Tissue Organ Cult 68: 1-19.
- Chandrika M, Rai VR (2009) Genetic fidelity in micropropagated plantlets of Ochreinauclea missionis an endemic, threatened and medicinal tree using ISSR markers. Afr J Biotechnol 8: 2933-2938.
- Leva AR, Petruccelli R, Rinaldi LMR (2012) Somaclonal variation in tissue culture: a case study with Olive, in: A. Leva (Ed.), Recent advances in plant in vitro culture 123.
- Phillips RL, Kaepplert SM, Olhoft P (1994) Genetic instability of plant tissue cultures: breakdown of normal controls. Proc Nati Acad Sci USA 91: 5222-5226.
- Bonato ALV, Calvo ES, Geraldi IO, Arias CAA (2006) Genetic similarity among soybean (Glycine Max (L) Merrill) cultivars released in Brazil using AFLP markers. Genet Mol Biol 29: 692-704.
- Jackson JH (1999) Technical reports and reviews-terminologies for gene and protein similarity, Michigan state university: Department of Microbiology 2018.
- Butiuc K, Farkas A, Cristea V (2016) Genetic stability assessment of in vitro plants by molecular markers. Studia UBB Biologia 61: 107-114.
- Kuras, Korbin M, Urawicz EZ (2004) Comparison of suitability of RAPD and ISSR techniques for determination of Strawberry (Fragaria X Ananassa duch.) Relationship. Plant Cell Tissue Organ Cult 79: 189-193.
- Elsheikh MH, Allah ASEA, Elsabagh AS (2014) Morphological characterization and genetic analysis by using RAPD and ISSR markers of some olive cultivars grown in Egypt. WASJ 30: 420-427.
- Spooner D, Treuren RV, De Vicente MC (2005) Molecular markers for gene bank management, IPGRI technical bulletin no. 10. International plant genetic resources institute, Rome, Italy.
- Doyle JJ, Doyle JL (1990) Isolation of plant DNA from fresh tissue, Focus 12: 13-15.
- Gawel NL, Jarret RL (1991) A modified CTAB DNA extraction procedure of Musa and Ipomoea. Plant Mol Biol Rep 9: 262-266.
- Sneath PHA, Sokal RR (1973) Numerical taxonomy: the principles and practice of numerical classification. Q Rev Biol 50: 525-526.
- Rohlf FJ (2000) NTSYSPC: Numerical taxonomy and multivariate analysis system, Version 2.02. Exeter software, Setauket, New York.
- Rohlf FJ, Marcus IF (1993) A revolution in morphometrics, Trends Ecol Evol 8: 129-132.
- Jaccard P (1908) Nouvelles recherches sur la distribu- tion florale. Bull Soc Vaudoise Sci Nat 44: 223-270.
- Anand (2003) Studies on genetic stability of micropropagated plants and reintroduction in an endemic and endangered taxon: Syzygium travancoricum Gamble (Myrtaceae). J Plant biol 5: 201-207.
- Leroy T, Le cam B, Lemaire C (2014) When virulence originates from non-agricultural hosts: new insights into plant breeding. Infect Genet Evol 27: 521-529.
- Moulin MM, Rodrigues R, Gonçalves LSA, Sudre CP, Pereira MG (2012) A comparison of RAPD and ISSR markers reveals genetic diversity among Sweet Potato Landraces (Ipomoea batatas (l.) Lam.). Acta Sci Agron 34: 139-147.
- Srivastav PP, Vijayan K, Awasthi AK, Saratchandra B (2004) Genetic analysis of Morus alba through RAPD and ISSR markers. Indian J Biotechnol 3: 527-532.
- Velasco-Ramírez AP, Torres-Moran MI, Molina-Moret S, Sanchez-Gonzalez JDJ, Santacruz-Ruvalcaba F (2014) Efficiency of RAPD, ISSR, AFLP and ISTR markers for the detection of polymorphisms and genetic relationships in Camote de cerro (Dioscorea spp.). Electron J Biotechnol 17: 65-71.
- Morales RGF, Resende JTV, Faria MV, Andrade MC, Resende LV, et al. (2011) Genetic similarity among strawberry cultivars assessed by RAPD and ISSR markers. Sci Agric 68: 665-670.
- Saleh (2011) Efficiency of RAPD and ISSR markers in assessing genetic variation in Arthrocnemum macrostachyum (chenopodiaceae). Braz Arch Biol Technol 54: 859-866.
- Kuras A, Korbin M, Zurawicz E (2004) Comparison of suitability of RAPD and ISSR techniques for determination of Strawberry (Fragaria × Ananassa Duch.) relationship. Plant Cell Tissue Organ Cult 79: 189-193.

