Key words
land races of bread wheat, drought stress indices, screening techniques.
Introduction
Plants have had to cope with periodic and unpredictable environmental stresses during growth and development
because of their early migration from aquatic environments to the land. Surviving such stresses over a long
evolutionary scale led them to acquire mechanisms by which they can sensitively perceive incoming stresses and
regulate their physiology accordingly [34]. In recent years, interest in crop response to environmental stresses has
greatly increased because severe losses may result from heat, cold, drought and high concentrations of toxic mineral
elements [5]. Drought is one of the most damaging abiotic stresses affecting agriculture. It is an important abiotic
factor affecting the yield and yield stability of food cereals and this stress acts simultaneously on many traits leading
to a decrease in yield [1,34,29]. Wheat grows as a rain-fed crop in semi-arid areas, where large fluctuations occur
in the amount and frequency of events from year to year and insufficient water is the primary limitation to wheat
production worldwide [2]. Generally, different strategies have been proposed for the selection of relative drought
tolerance and resistance, so some researchers have proposed selection under non-stress conditions [23,3], others
have suggested selection in the target stress conditions [7,25] while, several of them have chosen the mid-way and
believe in selection under both non-stress and stress conditions [12,8,11,23]. In a study on wheat [30], reported
that grain yield under irrigated conditions was adversely correlated with rain-fed conditions and they stated that, a
high potential yield under optimum conditions does not necessarily result in improved yield under stress conditions.
Also, Blum, [5] suggested that genotypes with high yield may not be stress resistant, so increasing the yield in these genotypes may be solely due to their high potential yield, and not due to stress resistance mechanism. However,
Richard et al. [26] believed that yield selection in the absence of drought is an effective method to improve yield in
dry areas. Selecting wheat lines based on their yield performance under drought conditions is a common approach.
Another approach to identify tolerant genotypes to dry environment is that some drought stress indices or selection
criteria have been suggested by different researches [31,22]. Stress tolerance index (TOL) and mean productivity
(MP) were defined as the difference in yield and the average yield between stress and non-stress environments,
respectively [27]. Other yield based index is geometric mean productivity (GMP) that is often used by breeders
interested in relative performance, since drought stress can vary in severity in field environment over years [24]
Another selection criterion for a high yielding cultivar under drought conditions is stress susceptibility index (SSI)
proposed by Fischer and Maurer, [12]. Stress tolerance index (STI) was defined as a useful tool for determining high
yield and stress tolerance potential of genotypes [11]. Yield stability index (YSI) was also suggested by Bouslama
and Schapaugh, [6]. This parameter is calculated for a given genotype using grain yield under stress relative to its
grain yield under non-stress conditions. The genotypes with high YSI is expected to have high yield under stress and
low yield under non-stress conditions [20]. Lan [18] defined a new drought resistance index (DI), which was
commonly accepted to identify genotypes producing high yield under both stress and non-stress conditions. To
improve the efficiency of STI a modified stress tolerance index (MSTI) was proposed by Farshadfar and Sutka, [10].
It was calculated as ki STI, where ki is a correction coefficient which corrects the STI as a weight. Therefore, k1STI
and k2STI are the optimal selection indices for stress and non-stress conditions, respectively. Indices ATI and SSPI
are able to separate relative tolerant and no tolerant genotypes [21]. Fischer et al. [12] introduced another index as
relative drought index (RDI). Bidinger et al. [4] suggested drought response index (DRI) with its positive values
indicating stress tolerance.
The objectives of the present investigation were (i) to discriminate drought tolerant landraces of bread wheat and (ii)
screening drought tolerance indicators.
Materials and Methods
Twenty landraces of bread wheat (Triticum aestivum L.) listed in Table 1 were provided from Seed and Plant
Improvement Institute of Karaj, Iran. They were assessed using a randomized complete block design with three
replications under two irrigated and rainfed conditions during 2010-2011 growing season in the experimental field
of College of Agriculture, Razi University, Kermanshah, Iran (47° 9′ N, 34° 21′ E and 1319 m above sea level).
Mean precipitation in 2010–2011 was 509.50 mm. The soil of experimental field was clay loam with pH7.1. Sowing
was done by hand in plots with three rows 2 m in length and 20 cm apart. The seeding rate was 400 seeds per m2 for
all plots. At the rainfed experiment, water stress was imposed after anthesis. Non-stressed plots were irrigated three
times after anthesis, while stressed plots received no water. At harvest time, yield potential (Yp) and stress yield
(Ys) were measured from 2 rows 1 m in length. Drought resistance indices were calculated using the following
relationships:
Table 1. Names and codes of genotypes
1) Stress susceptibility index = 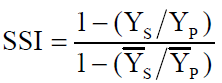 [12].
[12].
2) Relative drought index 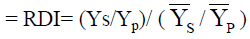 [12].
[12].
3) Tolerance = TOL = YP - YS [27].
4) Mean productivity = 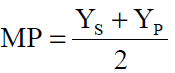 [27].
[27].
5) Stress tolerance index = 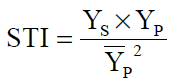 [11].
[11].
6) Geometric mean productivity = 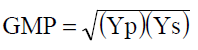 [11].
[11].
7) Yield index 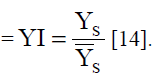
8) Yield stability index 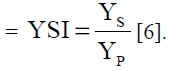
9) Drought response index = DRI= (YA-YES) /(SES) [4].
10) Drought resistance index 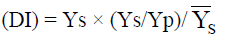 [18]
[18]
11) Modified stress tolerance index 
where ki is the correction coefficient.
12) Abiotic tolerance index 
13) Stress susceptibility percentage index 
In the above formulas, YS, YP,  represent yield under stress, yield under non-stress for each genotype,
yield mean in stress and non-stress conditions for all genotypes, respectively. YA, YES and SES are representative of
yield estimate by regression in stress condition, real yield in stress condition and the standard error of estimated
grain yield of all genotypes, respectively.
represent yield under stress, yield under non-stress for each genotype,
yield mean in stress and non-stress conditions for all genotypes, respectively. YA, YES and SES are representative of
yield estimate by regression in stress condition, real yield in stress condition and the standard error of estimated
grain yield of all genotypes, respectively.
For screening drought tolerant genotypes a rank sum (RS) was calculated by the following relationship:
Rank sum (RS) = Rank mean (  ) + Standard deviation of rank (SDR) and SDR= (S2i)0.5 [9].
Statistical analysis
Correlation analysis and principal component analysis (PCA), based on the rank correlation matrix and biplot
analysis were performed by SPSS ver. 16, STATISTICA ver. 8 and Minitab ver.16.
Results and Discussion
The results showed that water stress decreased yield of all genotypes significantly. Maximum decrease in the yield
was observed in genotypes 2 and 12. Nevertheless, the yield values were increased after drought stress in genotypes
4, 13 and 15 against the other varieties in the same condition (Table 2). The estimates of stress tolerance attributes
(Table 2) indicated that the identification of drought-tolerant genotypes based on a single criterion was
contradictory. For example, according to STI and GMP genotypes 20, 14 and 7 were the most drought tolerant,
whereas genotypes 16, 12 and 2 were the least relative tolerant genotypes. For TOL and SSI the desirable droughttolerant
genotype was 15. As to YI genotypes 14, 20 and 13 were the most and 16, 2 and 12 the least relative
tolerant genotypes (Table 2). According to RDI and DI indices genotype 15 was the most relatively tolerant
genotype, while for DRI the genotype 20 was the most relative tolerant. According to k1STI the genotypes 8, 18 and
14 and according to K2STI the genotypes 20, 13 and 14 were the most relative tolerant.
Table 2. Ranks (R), ranks mean () and standard deviation of ranks (SDR) of indicators of drought tolerance
Screening drought tolerant genotypes and indices
(i) Principal component analysis method
Plant breeders are employing PCA as a “pattern finding method” to complement cluster analysis [28]. The main
advantage of using PCA over cluster analysis is that each statistics can be assigned to one group only [17]. The
relationships among different indices are graphically displayed in a biplot of PCA1 and PCA2 (Figure 1). The first and
second components justified 88.30% of the variations. The PCA1 and PCA2 mainly distinguish the indices in
different groups. One interesting interpretation of biplot is that the cosine of the angle between the vectors of two
indices approximates the correlation coefficient between them. The cosine of the angles does not precisely translate
into correlation coefficients, since the biplot does not explain all of the variation in the data set. Nevertheless, the
angles are informative enough to allow a whole picture about the interrelationships among the drought indices [33].
SSPI, TOL, ATI, SSI and MP were classified as group 1= G1. The PCs axes separated Ys, YI, k1STI, k2STI, STI,
GMP and Yp in group two (G2) and YSI, ATI, RDI, DI and DRI in group three (G3). The "drought resistance"
should be based on yield stability under water deficits. Thus the genotypes with low fluctuations under different
stress environments can be considered as "drought resistant" genotypes. In our case ATI, RDI, DI and DRI can be
used to screen "drought resistant" genotypes as they are strongly associated (acute angle) with YSI (yield stability
index). In contrast, "drought tolerance" should not be based on yield stability but it refers to genotypes with
acceptable yield performance under stress and high yield performance under non-stress environments. Thus, YI,
k1STI, k2STI, STI, GMP can be considered as tools for screening "drought tolerant" genotypes as they are not
associated with YSI (right angle) or they have negative correlation (obtuse angle).
Figure 1. Screening drought tolerance indicators using biplot analysis.
The vector view of the biplot (Figure 1) provides a summary of the interrelationships among the drought indicators.
Principal component analysis (PCA) exhibited that significant positive correlation was found between grain yield in
the stress condition (Ys) with criteria STI, GMP, YI, and MSTI, accordingly they can discriminate drought tolerant
genotypes at the same manner.
This procedure was also employed in durum and bread wheat [9,19] for screening selection criteria of different
climate and water regime conditions. Using the biplot diagram (Figure 2) genotypes 4, 19, 20, 14 and 7 were identified
as tolerant and genotypes 2, 12, 16, 1 and 11 were detected as sensitive to drought.
Figure 2. Biplot based on first and second components of drought tolerance indices.
Genotypes can be categorized into four groups based on their performance in stress and non-stress environments:
genotypes which express uniform superiority in both stress and non-stress environments (Group A); genotypes
which perform favorably only in non-stress environments (Group B); genotypes which yield relatively well only in stress environments (Group C) and genotypes which perform poorly in both stress and non-stress environments
(Group D). The optimal selection criteria should distinguish group A from the other three groups [11].
A three-dimensional representation of Ys, Yp and STI is shown in Figure 1. The area of the 3D plot was divided
into 4 regions, A, B, C and D [11]. Genotypes 20, 14 and 19 were placed in a region of the plot which had the
highest STI, Ys and Yp (Figure 3). Clarke et al. [8] showed that yield-based SSI index did not differentiate between
potentially drought resistant genotypes and those that possessed low overall yield potential. Similar limitations were
reported by White and Singh [32]. Selection through TOL chooses genotype with low YP but with high YS (group
C), hence, TOL deficiencies to distinguish between group C and group A [11]. MP is mean yield for a genotype in
two stress and non-stress conditions. MP can select genotypes with high YP but with relatively low YS (group B) and
it fails to distinguish group A from group B. By decreasing TOL and increasing MP, the relative tolerance increases.
Rosielle and Hamblin, [27] and Fernandez, [11] demonstrates a high tolerance and the best advantage of STI is its
ability to separate group A from others. GMP is more powerful than MP in separating group A and has a lower
susceptibility to different amounts of YS and YP so; MP, which is based on arithmetic mean, will be bias when the
difference between Y S and YP is high. As described by Hohls, [16], MP cannot select high yielding genotypes in
both stressed and non-stressed environments, if the correlation yield in contrasting environments is highly negative.
MP is related to yield under drought stress if it is not too severe and the difference between YR and YI is not too
large. In these cases, genotypes with a high MP would belong to group A.
Figure 3. Three-dimensional plot between Yp, Ys and STI.
On the other hand index like STI was moderately heritable and are usually able to select high yielding genotypes in
both environments. Talebi et al. [31] also reported that cultivars producing high yield in both drought and well
watered conditions can be identified by STI, GMP and MP values. Pireivatlou et al. [22] was also noted that STI can
be a reliable index for selecting high yielding genotypes. In the STI index, Yp2 is a constant value, while the square
root of the multiplication of Yp and Ys is the geometric mean of a genotype under stress and non-stress conditions.
For this reason a pair of numbers with different natures may have the same geometric mean. This problem arises in
the stress tolerance index (STI) and hence decreases its efficiency in distinguishing group A genotypes from the
other groups. To improve the efficiency of STI a modified stress tolerance index (MSTI) was calculated as kiSTI,
where ki is a correction coefficient which corrects the STI as a weight. Therefore, k1STI and k2STI are the optimal
selection indices for stress and non-stress conditions, respectively [10].
Golabadi et al., [15] reported that selection for TOL will be worthwhile only when the target environment is nodrought
stressed. ATI or SSPI select genotypes especially on the basis of yield stability, while, selection by SNPI is
based on two characteristics simultaneously, namely yield stability as well as high YP and YS (with more emphasis
on high YS than high YP) [21]. YI, proposed by Gavuzzi et al. [14] as significantly correlated with stress yield. This
index ranks cultivars only on the basis of their yield under stress and so does not discriminate genotypes of group A.
YSI, as Bouslama and Schapaugh, [6] stated, evaluates the yield under stress of a cultivar relative to its non-stress
yield, and should be an indicator of drought resistant.
(ii) Ranking Method
The estimates of in vivo indicators of drought tolerance (Table 2) indicated that the identification of drought-tolerant
genotypes based on a single criterion was contradictory. Different indices introduced different landraces as drought
tolerant.
To determine the most desirable drought tolerant genotype according to the all indices mean rank, standard
deviation of ranks and rank sum (RS) of all in vivo drought tolerance criteria were calculated. With regard to all
indices, genotypes WC-4953S (20; RS= 10.82), WC-47572 (19; RS= 11.04) and WC-47574 (4; RS= 12.49) were
the most drought tolerant genotypes, respectively. While genotypes WC-4506 (2; RS=20.66), WC-47620(12;
RS=20.06) and WC-47358 (16; RS=19.09) were the most sensitive to drought.
Conclusion
The "drought resistance" should be based on yield stability under water deficits. Thus the genotypes with low
fluctuations under different stress environments can be considered as "drought resistant" genotypes. In our case ATI,
RDI, DI and DRI can be used to screen "drought resistant" genotypes as they are strongly associated (acute angle)
with YSI (yield stability index). In contrast, "drought tolerance" should not be based on yield stability but it refers to
genotypes with acceptable yield performance under stress and high yield performance under non-stress
environments. Thus, YI, k1STI, k2STI, STI, GMP can be considered as tools for screening "drought tolerant"
genotypes as they are not associated with YSI. In conclusion, based on principal component and biplot analysis, the
indices of group 2 (G2) YI, k1STI, k2STI, STI and GMP exhibited strong correlation (acute angles) with Ys and Yp, therefore, they can discriminate drought tolerant genotypes with high grain yield at the same manner under
stress and nonstress conditions (group A of Fernandez).
With regard to all indices, genotypes WC-4953S (20; RS= 10.82), WC-47572 (19; RS= 11.04) and WC-47574 (4;
RS= 12.49) were the most drought tolerant genotypes, respectively.
Acknowledgment
The authors express their appreciations to the Iran National Science Foundation for providing financial support to
this project (88002345).
References
- Abebe T, Arron CG, Bjorn M, John CC, 2003. Plant Physiol, 131:1748-1755.
- Ashraf M, Harris PJC, 2005. Abiotic stresses plant resistance through breeding and molecular approaches. Haworth Press Inc. New York.
- Betran FJ, Beck D, Banziger M, Edmeades GO, 2003. Crop Sci, 43:807-817.
- Bidinger FR, Mahalakshmi V, Rao DDP, 1978. Aust J Agric Res, 38:37-48.
- Blum A, 1996. Plant Growth Regul, 20:135- 148.
- Bouslama M, Schapaugh WT, 1984. Crop Sci, 24:933–937.
- Ceccarelli S, Grando S, 2000. Euphytica, 57:157-167.
- Clarke JM, DePauw RM, Townley-Smith TF, 1992. Crop Sci, 32:723–728.
- Farshadfar E, Elyasi P, Aghaee M, 2011. Amer J of Sci Res, 48:102-115.
- Farshadfar E, Sutka J, 2002. Acta Agron Hung, 50:411–416.
- Fernandez GCJ, 1992. Effective selection criteria for assessing stress tolerance. In: Kuo CG (ed), Proceedings of the international symposium on adaptation of vegetables and other food crops in temperature and water stress. Public Tainan Taiwan 257–270.
- Fischer RA, Maurer R, 1978. Aust J Agric Res, 29:897-912.
- Fischer RA, Wood JT, 1979. Aust J Agric Res, 30:1001–1020.
- Gavuzzi P, Rizza F, Palumbo M, 1997. Canad J of Plant Sci, 77:523-531.
- Golabadi M, Arzani A, Mirmohammadi Maibody SAM, 2006. Afr J Agr Res, 1:162-171.
- Hohls T, 2001. Euphytica, 120:235-245.
- Khodadadi M, Fotokian MH, Miransari M, 2011. Aust J Crop Sci, 5: 17-24.
- Lan J, 1998. Acta Agricult Bor-occid Sinic, 7:85-87.
- Mohammadi M, Karimizadeh R, Abdipour M, 2011. Aust J Crop Sci, 5:487- 493.
- Mohammadi R, Armion M, Kahrizi D, Amri A, 2010. Inter J of Plant Product, 4:11-14.
- Moosavi SS, Yazdi Samadi B, Naghavi MR, Zali AA, Dashti H, Pourshahbazi A, 2008. Desert, 12:165-178.
- Pireivatlou AS, Masjedlou BD, Aliyev RT, 2010. Afric J Agric Res, 5:2829-2836.
- Rajaram S, Van Ginkle M, 2001. Mexico, 50 years of international wheat breeding, Bonjean AP, WJ Angus, (Eds.), The World Wheat Book: A History of Wheat Breeding. Lavoisier Publishing, Paris, France, 579-604.
- Ramirez P, Kelly JD, 1998. Euphytica, 99:127-136.
- Rathjen AJ, 1994. The biological basis of genotype-environment interaction: its definition and management, In ‘Proceedings of the Seventh Assembly of the Wheat Breeding Society of Australia, Adelaide, Australia. (Eds J Paull, et al.) pp. 13–17.
- Richard JS, Patterson P, Carter TE, 1990. Crop Sci, 30:118-123.
- Rosielle AA, Hamblin J, 1981. Crop Sci, 21:943-946.
- Sajjad M, Khan SH, Salman Khan A, 2011. Int J Agric Biol, 13:695-700.
- Sebnem K, 2012. Int J Agric Biol, 14:401-406.
- Sio-Se Mardeh A, Ahmadi A, Poustini K, Mohammadi V, 2006. Field Crop Res, 98:222-229.
- Talebi R, Fayaz F, Naji AM, 2009. General and Appl Plant Physiol, 35:64-74.
- White JW, Singh SP, 1991. Breeding for adaptation to drought. In: A van Schoonhoven and O. Voysest (Eds.), Common Beans, Research for Crop Improvement, pp. 501–560. CAB Int CIAT, Colombia.
- Yan W, Kang MS, 2003. Biplot analysis: A graphical tool for breeders, geneticists and agronomist, CRC Press, Boca Raton FL, pp 313.
- Zhang J, Wensuo J, Jianchang Y, Abdelbagi MI, 2006. Field Crop Res, 97:111-119.


