Keywords
tomatoes, urea, potassium, phosphorus, pH soil.
Introduction
Tomato (Lycopersicom esculentum L.) is one of the flowering higher plants from dicotyledonous order and
Solanaceae family. This plant is native to Central and South America, which during the Spanish colonial period
were transferred to other parts of the world [4]. Nowadays, different type of this plant is grown throughout the
world. Tomato is rich in vitamin C and Lycopene [4]. Tomatoes are rich in vitamins A, B and C, iron, phosphorus
and boron minerals are particularly abundant. Potassium is another mineral essential elements needed by the plants
that most soils except sandy soil potassium reserves ratio as a whole. Most plants absorb large amounts of potassium
and potassium uptake by plants is higher than all other nutrients except nitrogen. Desirable when the leaves are
about 2% of the value of 1/5 percent less likely to develop symptoms into strips at the edges and margins of the
leaves are purple. Potassium activates enzymes are also involved in protein synthesis Dardvdr potassium deficiency
and accumulation of amino acids, soluble sugars are soluble in concentrated nitric acid have the hope and the role of
potassium in protein synthesis. Potassium is a plant resistance against dehydration and hypothermia. Potassium is
the major cation which neutralizes the electrical charge of anions in chloroplasts Cytoplasm to reduce nitrate
accumulation in vegetables and Jat is Shvdbas. Green spot disease (green tomatoes at the end) that is insipid and
tasteless, is due to potassium deficiency. Another indicator of the pH of the nutrient uptake is an indicator of acidity
and play on medium plants and chemical characteristics, physical and biological soil properties is effective [13].
Phosphate concentration in the root is about 100-1000 times the concentration of phosphate in the soil solution.
Small part of P also is converting to organic compounds in the plant that are consisting: phospholipids, phosphorous
sugar, DNA, ADP and ATP, which are energy carrier. Phosphorous led to roots growth. Phosphorous is causing to
early ripening and enhancement of generative growth and in the fruit trees is leading to fruit early ripening and
improvement of fruits and vegetables quality [5]. pH is one of the other effective factors for uptake of nutrient
elements, which it is acidity and alkalinity index in plant culture medium and is effective on soil chemical, physical
and biological properties [10]. The study was conducted in Vertisol pellic of phosphorus fertilizer on tomato and
eggplant used as fertilizer, irrigation and fertilizer P from triple super phosphate sources were used to prepare and
test results showed that the yield increases when FERTIGATION phosphorus fertilizer to be used. Shalmani
Mousavi et al [15] experiment in Agricultural Research and Nuclear Medicine Branch, under drip fertigation, as
Chharkrt (each with dimensions 10 × 3 mm) were performed and Drchhartkrar. The irrigation system was designed
in such a way that Hrkrt of three irrigation line length of 10 meters and a distance of one meter from each other, and
then Hrqtrh emitters spaced 0.5 m were considered. For injection of fertilizer elements in the irrigation system, use a
fertilizer injection pump. Frvhmkaran Wilson in 2010 tested the effect of phosphorus on spinach Dadndv results
showed that increasing soil P level of performance in all phases of plant P increased but not significant.
Materials and Methods
In this study, the effect of phosphorus and potassium in soils with different pH evaluated. For this purpose three
soils with a pH of 6, 7 and 8 pick and choose some pots and 5 kg of soil poured Hrgldan The Treatments containing
phosphorus levels 0, 40 and 80 mg P kg soil as triple super phosphate and potassium source with three levels of 0,
40 and 80 mg kg soil potassium sulfate, potassium added to the pots. The first two seeds in each pot of tomato
cultivated varieties of G. We then seed germination and plant four bushes to form stronger hold another've cut
surface. After planting the seed treatments applied during plant growth and soil moisture tried about field capacity is
N-plants to provide 200 mg of urea nitrogen per kg of soil from the pots Additional. Retention time of 30 days after
the first flowering plants in the soil in the pot. National factors that were measured included the number of days
required for flowering in each treatment, the number of flowers and fruits of conversion, the total weight and the
average weight of each product expressed during tomato, value of fruit sugar, Introduction the acid in fruit fresh
weight plant. As we see the number of treatments and the number of iterations, respectively, in this study a total of
27 treatments and 3 replications were 81 pots.
The attributes measured
The number of days for flowering for each pot.
Total fruit.
The pH: the flooding and smooth tomato juice, the pH was measured using pH meter Hvryba model.
Vitamin C: 10 ml of tomato juice smoothie with 20 ml of distilled water and 2 mL of 1% starch using iodine
solution in potassium iodide was titrated to achieve the amount of iodine in iodide of potassium, olive green, the
amount numeric 8/8 by multiplying the milligrams of vitamin C per 100 cc of juice obtained.
Plant fresh weight after separating from each other, shoot and root weight of each g sensitivity was measured with
a laboratory scale.
Dry weight of the plant: plant samples at temperatures between 60 to 75 degrees in the oven vents are placed to
dry. After 48 hours, the dried sample weight were recorded.
Total acid: 5 ml of tomato juice smoothie with 5-3 drops of phenol Ftalyn (acid reagent) using Profit 3/0 red
headline normal was achieved. Then use the following formula to calculate the total acid milligrams were:
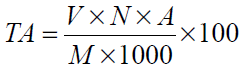
Where TA: MG TA, V: The amount of consumer interest, N: normalized profit (3/0), A: Valence hot acid (64) and
M: weight of sample (2/5 g), respectively.
Percent of the total soluble solids :value of this attribute using fruit juice smoothie and Rfrktvmtr was measured
manually.
Chlorophyll: content in leaves, flowering time of GREENS GREENS system based on chlorophyll meter Minolta
Japan was measured.
Statistical calculations
This research is based on a completely randomized design with 27 treatments and 3 replications. Treatments
consisted of three levels, 40 and 80 mg per kg of nitrogen, potassium and phosphorus from the soil. Statistical
analysis using software MSTA-TC and mean comparison using Duncan's new multiple range test was performed at
1%.
Results
Namber flowers
As can be seen from Table 1.1 Effect of pH on the number of flowers showed significantly decreased with
increasing pH of the goal. So that the greatest number of goals pH 6 (3/7 goals) and lowest at pH 8 (9/2 goals) was
observed.
Table 1.1: Comparison of the effect of pH on the traits
Chlorophyll Index
As can be seen from Table 1.1 Effect of pH on specific SHA chlorophyll, chlorophyll indices showed significantly
increased with increasing pH. So that the maximum chlorophyll-specific train at pH 8, which is equal to 8/60
compared to pH 7 and 6 had a significant increase in chlorophyll at pH 6 which specific SHA least equal to 6/45 is a
significant decrease than pH 7 and 7 is.
Namber Fruit
As can be seen from Table 1.1, which has the highest number of fruits to pH 8 with 0/2, which is a significant
increase compared to pH 7. The least number of fruit at pH 7, which is equal to 6/1, which is significantly lower
than pH 8 than pH 6 the difference is not statistically significant.
Vitamin C
As can be seen from Table 1.1 the effect of pH has a significant effect on the maximum amount of Vitamin C
Vitamin C in pH 7 which equals 51/46 ratio pH 8, and 6 increased has a significant the least amount of vitamin C,
which corresponds to pH 8 with 68/38 which is significantly lower than pH 7.
pH
As can be seen from Table 1-1, the maximum amount of fruit PH was related to pH 7 with 42/5 compared to pH 6
increased significantly, but there was no significant difference with respect to pH 8. The least amount of fruit PH pH
6 which equals 97/4, which is significantly lower than pH 7 and 8.
TSS
As can be seen from Table 1-1, the maximum amount of TSS, pH 8, which is equal to 71/5 ratio increased to pH 6
and 7, but this increase was not significant. The lowest rate of TSS at pH 7 is equal to 14/5 is reduced, but this
reduction was not significant compared to pH 6 and 8.
The total acid
As can be seen from Table 1-1, the maximum amount of fruit acid to pH 6, which is equal to 716/0, which is a
significant increase compared to pH 7 and 8. The least amount of fruit acid to pH 8, which is equal to 572/0, which
is significantly lower than pH 7.
Plant fresh weight
As can be seen from Table 1-1 Maximum weight per plant was related to pH 8 with 065/28 had significantly
increased compared to pH 7 But there is no significant difference with respect to pH 6. The lowest fresh weight per
plant was related to pH 7 with 326/19 which is significantly lower than pH 8.
Plant dry weight
As can be seen from Table 1.1, the highest plant dry weight, pH 8, which is equal to 499/10 which is a significant
increase compared to pH 7. The lowest plant dry weight, pH 7, which is equal to 675/7, which is significantly lower
than pH 8 than pH 6, but the difference was not statistically significant.
Days to flowering
As can be seen from Table 1.1 the effect of pH has a significant effect on the maximum number of days to
flowering, days to flowering was pH 8 with 5/46 compared to pH 7 and 6 increased significantly there was also a
minimum number of days to flowering was related to pH 7 with 5/27, which is significantly lower than pH 6 and 8.
Discussion
Comparison of treatment effects from the interaction of potassium and phosphorus on the traits
Number of folawer
As is noticeable in Table 2.2 review potassium and phosphorus interaction showed that the highest number of goals
in the control treatment (no use of potassium and phosphorus) (0/10 goals) and lowest in the 80 mg per kg of
potassium No phosphorus (4/2 goals) was observed. Plants grown under the influence of 80 milligrams per liter and
80 mg of phosphorus, potassium, and 40 were all destroyed. K-free environment, with increasing P concentration,
decreased the number of flowers. Medium containing 40 mg l potassium, potassium increases from zero to 40 and
40 to 80 increased the number of flowers decreased significantly.
Figure 2: HPLC chromatogram of the nine reference compounds in 50% aqueous methanol, measured at 370nm. Retention times for rutin, sutherlandin A, sutherlandin B, kaempferol-3-O-rutinoside, sutherlandin C, sutherlandin D, quercitrin, quercetin and kaempferol were 11.9, 12.7, 13.8, 15.3, 16.2, 17.0, 18.0, 26.2 and 28.1 minutes, respectively.
Chlorophyll Index
As is noticeable in Table 2.2 review potassium and phosphorus interaction showed that maximum chlorophyll index
in the treatment of 40 mg of potassium and 80 mg Fsfrbrabrba 9/54 and the least used without phosphorus,
potassium, 80 mg kg 5 / 34 was observed. K-free environment, with increased levels of phosphorus, chlorophyll
index increase was non-significant. Medium containing 40 mg l Potassium, Potassium increases chlorophyll index
increased from zero to 40 and 40 to 80 decreased significantly.
Table 2.2: Comparison of treatment effects on the characteristics of the interaction of potassium and
phosphorus
Numbern of Fruit
As is noticeable in Table 2.2 review potassium and phosphorus interaction showed that the highest number of fruits
per treatment, 40 mg of potassium and 80 mg of phosphorus equal to 5/2 and the lowest 40 mg kilograms of
potassium, without P-1/1 was observed. Plants grown under the influence of 80 milligrams per liter and 80 mg of
phosphorus, potassium, and 40 were all destroyed. K-free environment, with increased levels of phosphorus, nonsignificant
increase in the number of fruits. Medium containing 40 mg l potassium, potassium-increasing number of
fruits increased from zero to 40 and 40 to 80 decreased significantly.
Table 2.2: Comparison of treatment effects on the characteristics of the interaction of potassium and
phosphorus
VitaminC
As is noticeable in Table 2.2 review potassium and phosphorus interaction showed that the highest levels of vitamin
C, potassium, and 40 mg Fsfrbrabr with 91/47 and the lowest of 40 mg per kg of potassium and 40 mg kg phosphate equivalent to 07/41 was observed. Plants grown under the influence of 80 milligrams per liter and 80 mg of
phosphorus, potassium, and 40 were all destroyed. K-free environment, with increased levels of phosphorus, vitamin
C was significantly reduced. In environments with 40 milligrams per liter of potassium, vitamin C decreased with
increasing potassium from zero to 40 and 40 to 80, the difference was not significant.
PH
As is noticeable in Table 2.2 review potassium and phosphorus interaction showed the highest pH in the control
treatment (no use of potassium and phosphorus) is equal to 32/5 and the lowest levels of potassium and 80 mg warm
up with a 04/5 was observed. Plants grown under the influence of 80 milligrams per liter and 80 mg of phosphorus,
potassium, and 40 were all destroyed. K-free environment, with increasing levels of P, the rate of pH decrease was
non-significant. Medium containing 40 mg l potassium, pH decreased with increasing the amount of potassium from
zero to 40 and 40 to 80, no significant differences were observed.
TSS
As is noticeable in Table 2.2 review showed the greatest amount of interaction with potassium and phosphorus at
levels of potassium and 80 mg TSS Fsfrbrabr with 89/5 and the lowest of 40 mg per kg of phosphorus and
potassium without control treatment ( no use of potassium and phosphorus ) which is equal to 00 / 5 was observed .
Plants grown under the influence of 80 milligrams per liter and 80 mg of phosphorus , potassium, and 40 were all
destroyed. K-free environment , with increased levels of phosphorus , TSS levels increased significantly . Medium
containing 40 mg l potassium, potassium increases from zero to 40 and 40 to 80 increased levels of TSS decreased
significantly .
The total acid
As is noticeable in Table 2.2 review potassium and phosphorus interaction revealed that most of the acid in the
levels of potassium and 80 mg Fsfrbrabr with 831/0 and lowest in the control treatment (no use of potassium and
phosphorus) which equals with 462/0, respectively. Plants grown under the influence of 80 milligrams per liter and
80 mg of phosphorus, potassium, and 40 were all destroyed. K-free environment, with increased levels of
phosphorus, total acid increased significantly. Medium containing 40 mg l potassium, total acid decreased with
increasing potassium from zero to 40 and 40 to 80 showed a significant increase.
Plant fresh weight
As is noticeable in Table 2.2 review potassium and phosphorus interaction showed the highest plant fresh weight at
40 mg Potassium 80 mg Fsfrbrabr with 564/27 and lowest in the control treatment (no use of potassium and
phosphorus ) which is equal to 780/19 was observed. Plants grown under the influence of 80 milligrams per liter and
80 mg of phosphorus, potassium, and 40 were all destroyed. K-free environment, with increased levels of
phosphorus, plant fresh weight increase was non-significant. Medium containing 40 mg l potassium, plant fresh
weight increased with increasing potassium from zero to 40 and 40 to 80 decreased significantly.
Plant dry weight
As is noticeable in Table 2.2 review potassium and phosphorus interaction showed the highest dry weight at 40 mg
Potassium and phosphorus levels equal to 769/9 and use the lowest level zero phosphorus, potassium, and 80 mg
versus with 742/7 was observed. Plants grown under the influence of 80 milligrams per liter and 80 mg of
phosphorus, potassium, and 40 were all destroyed. K-free environment, with increased levels of phosphorus, dry
weight was significantly reduced. Medium containing 40 mg l potassium, potassium increases from zero to 40 dry
weight increase was significantly reduced from 40 to 80.
Days to flowering
As is noticeable in Table 2.2 review potassium and phosphorus interaction showed the greatest number of days to
flowering in the control treatment ( no use of potassium and phosphorus ) equal to 6/44 and the lowest of 40 mg per
kg phosphorus , potassium, and 80 milligrams per kilogram is equal to 1/24 , respectively. Plants grown under the
influence of 80 milligrams per liter and 80 mg of phosphorus , potassium, and 40 were all destroyed. K-free
environment , with increasing levels of P , the number of days to flowering was significantly decreased . Medium
containing 40 mg l potassium, potassium increases from zero to 40 days to flowering decreased from 40 to 80
showed a significant increase .
The general conclusions
According to the results of these tests can be expressed using phosphorus and potassium fertilizers to enhance
vegetative and reproductive factors in tomato plants to be effective and the positive effect will. The combined use of
these two significant interaction effect on vegetative and reproductive tomato plant will separate the use of
phosphorus 80 mg, with pH 7 is the best treatment.
References
- Aduayi . , EA, MK Idowu, Journal of Plant Nutrition, pages: 2006, 2131-2145.
- B. P. Chapagain, Z. Wiesman, M. Zaccai,1 P. Imas, and H. Magen. JOURNAL OF PLANT NUTRITION, 2003, pp. 643–658.
- Oskooei AR, Ali-Asgharzadeh P, Baghban S. Journal of Agricultural and Natural Resources Sciences. 2005, 82:849-857.
- Peivast GH. Olericulture. Guilan University Press, first edition, 2006, p. 320.
- Rajaei M. 2010. Khayam Press.
- Rokhsar P, Shokri-Vahed H, Asadi MA, Davari K, Peivast GH. Water and Soil Sciences, 2010, 4(53), 2322- 2425.
- Daryani M., M.., master's thesis, University jahrom. 1997.
- Shirazi, M.., Volume 36, Issue 6, 1995, pp. 1548-1539.
- Daneshvar MH. 2000. Vegetables growing. Shahid-Chamran University Press.
- Zahedifar M, Karimian N, Ronaghi AM, Yasrebi J, Emam Y. Journal of Greenhouse cultures Sciences and Techniques, 2010, 1(4): 45-52.
- Gheshlaghi A, Tafazoli E. Journal of Agricultural and Natural resources Sciences, 2004,11(4).48-312.
- Layegh M, Peivast GH, Samiezadeh HA, Khosousi M. Journal of Iranian Horticultural Sciences. 2009, 6(6):923-927.
- Malakouti MJ. 1996. Agricultural Education Press.
- Mommy, the., Gh. A.. Pyvast-D. Part of h. Samieezadeh lahiji. Horticultural Science (Agricultural Sciences and Technology), 1998, pp. 48-39.
- Mousavi Shalmani. M.. The., Sagheb, n., Khorasani. AS., Mjl Agricultural Science and Technology of Iran. 1993.


