Keywords
Bioassays; Hematology; Histopathology; Micronucleus; Methylmercury; Tropical fish
Introduction
Several effects are described for organisms exposed to pollutants in water, air and soil [1-3]. However, studies performed under controlled conditions, including the absence of any external variable interfering in the occurrence of any kind of effect on organisms are useful for understanding the direct effect of a contaminant. Such studies allow establishing cause effect relationships and avoid masking the action of other toxic substances. Bioassays are very useful tools to establish cause effect relationships as they do not allow other confounding factors, such as other pollutants, physical-chemical changes, to interfere within the results [4]. Besides the lethal concentration (LC50) or dose (LD50) for 50% of the tested population, other endpoints can be assessed, especially to investigate non-lethal effects. In this context, biomarkers could be applied, since they are, by definition, indicators of exposure to xenobiotics and of effects related to this exposure [5].
Among the persistent pollutants, mercury (Hg) is one of the most toxic, according to World Health Organization (WHO 1990), especially when it is present in the environment as methylmercury (MeHg), a neurotoxic and teratogenic substance to humans. Methylmercury bioaccumulates and biomagnifies in aquatic food webs, reaching high concentrations in top predators. For this reason, the main pathway of MeHg exposure to humans, aquatic mammals, marine reptiles and sea birds is the consumption of contaminated fish. Because of that, fish are commonly used as bioindicators on studies to evaluate mercury contamination [6].
Berntssen et al. noted significant changes in fish hematology when performing bioassays using Salmo salar fed with MeHg enriched food above 5 μg.g-1 [7]. Concentrations above 5 μg.g-1 are reported for carnivorous fish from artisanal and small-scale gold mining areas in Brazilian Amazon, being 5 times higher than the WHO recommended guideline for human consumption of carnivorous fish species (1 μg.g-1) [8, 9]. Laboratorial assays also showed the relationship between MeHg exposure and lower success on fish reproduction, due to the reduction on gonad development, including lower gonadosomatic indexes, increase on apoptosis of follicles and inhibition of testosterone production by males and estradiol by females, decreasing the number of eggs [10-13]. MeHg concentrations in eggs are extremely high, varying with the food items chosen by females [14]. Also, it’s reported on literature that MeHg can cause decrease spawning success, besides the reducing on eggs incubation success and survivor during development stages of embryos [11, 15-18]. All these factors have large effects on reproductive success, showing that methylmercury has multiple important impacts on reproduction.
Acetylcholinesterase is an enzyme that hydrolyzes acetylcholine molecules and it is an important regulatory enzyme that controls the transmission of nerve impulses across cholinergic synapses. Its inhibition has been commonly linked to organophosforades, carbamates and other pesticides exposure, but some studies observed its inhibition due to mercury exposure [1, 19-27]. Jesus et al. when considering neotropical fish species, evaluated possible effects on acetylcholinesterase activity and internal distribution of mercury in a carnivorous species (Hoplias malabaricus), due to intraperitonial injections of mercury and methylmercury chlorides [28, 29]. Costa et al. observed an inhibition of this enzyme on Hoplias malabaricus, using a methylmercury exposure dose of 75 ng g-1, in laboratory conditions, after 70 days of exposure to this contaminant by contaminated food ingestion (the preys were artificially contaminated with intraperitoneal injections) [30].
Thus, the objective of this study was to evaluate the effects of chronic methylmercury exposure on Astronotus ocellatus biomarkers (hematology, acetylcholinesterase activity, micronucleus frequency, histopathology of liver and gonads), as consequence of methylmercury exposure through artificially contaminated food (10 μg.g-1). This is a well-distributed omnivorous/carnivorous species in Amazon Region and outside this region, due to artificial introductions, it is territorialist, not performing seasonal migration, and it is consumed by humans. We expect to observe effects of experimental chronic methylmercury exposure on micronuclei frequency, liver lesions, anemia and induction of defense system.
Methods
Astronotus ocellatus (Agassiz, 1831)
The oscar (Astronotus ocellatus) is an Amazon Basin teleost fish species from Cichlidae family and it is considered a popular aquarium fish around the world. Also, it is an edible fish and is commonly consumed by Brazilians from North and Middle West Regions. This species reaches 25-30 cm of total length and weighs approximately 1.5 Kg in wildlife and tolerates waters with pH from 6.0 to 8.0 and temperatures from 22 to 25°C. It’s an omnivorous/ carnivorous species and includes in its diet zoobenthos (crayfish), zooplankton (insects larvae), fish (finfish) and plants (benthic algae, fruits, flowers and seeds from terrestrial plants). It was chosen for this first experiment because (i) it is easy to maintain in aquarium using a relative small volume of water, (ii) its food habit and (iii) previous studies at Tapajós River, Amazon Basin, noted hematological alterations on tucunarés (Cichla sp.) from artisanal and small-scale gold mining (ASSGM) areas, due to mercury exposure and tucunarés and oscars are from the same taxonomic family [31, 32].
Bioassays
The experiment lasted 180 days (six months), being the test group fed on fish food (commercial pellets; 40% of protein) artificially contaminated with methylmercury chloride solution (10 μg.g-1). This concentration was defined as the first to be tested according to the results described on Hammerschmitd et al. and Berntssen et al., who indicated that concentrations above 5 μg.g-1 were able to induce hematological disturbances on fish [7, 11].
The artificial contamination of the pellets followed the methodology described at Hammerschmitd et al. [11]. The food was stored in sealed plastic bags (Ziploc) and they were locked in sealed flasks and frozen. The total mercury concentrations in pellets were determined before and after the contamination procedure, resulting, respectively, in 0.020 (minimum)-0.037 (maximum) μg.g-1 and 9.0 ± 0.5 μg.g-1 (average ± standard deviation).
For this first study, eight specimens of A. ocellatus for test group and three specimens for control group (fed with the same commercial pellets, but without artificial enrichment on MeHg) were used. The number of specimens was not equal for both groups due to a space restriction at the laboratory, where the isolated room for the experiment did not have sufficient area to include more aquariums. This way, the maximum capacity of the room was for 11 aquariums and we chose to use a higher number of specimens on test group. These specimens were of both sex and were acquired from the same commercial breeder, with 4.0 cm of total length initially. They were maintained in individual aquariums of 50 L, with constant filtration and aeration and fed twice per day. The experiment began after six months of acclimatizing, in order to have sufficient weight and length (above 15 cm) to support healthily the blood collection, bimonthly. The aquariums were submitted to partial changes of water monthly. pH was measured once a week and the temperature was noted daily. Any observation related to behavior changes was recorded in the experiment booklet. Total mercury concentrations in water were monitored each 15 days and the contents were below the detection limit (5 ng.l-1) during all the experiment.
Sampling
Four blood sampling were performed during the experiment. The first sampling was on day 0, before any kind of exposure to methylmercury chloride. Once the experiment started, blood samples were collected bimonthly, where sampling 2 was carried out after two months of exposure of the test group, sampling 3, after four months and sampling 4, after six months, being the last day of experiment. For every sampling, biometry parameters were measured and hemogram, micronucleus frequency and total mercury in blood samples were determined. The other biomarkers were measure only on samples from the sampling number 4 (the last one), where different tissues were collected for total mercury determination (erythrocytes, plasma, muscles, liver, gonads), for acetylcholinesterase activity (muscles) and for histopathology (liver and gonads) (Figure 1).
Before every blood sampling, the volume that could be collected without causing any health problems to fish was calculated by using as base the body weight of each specimen, being equivalent to a maximum of 1% of body weight [33]. The blood was obtained by caudal puncture, using 1 ml syringes and needles caliber 20 × 0.55 mm, containing EDTA [34]. The samples were stored in 1.5 ml micro tubes and refrigerated until analysis. In order to minimizing stress during blood sampling, the specimens were calmly captured. Eyes (head) and body were covered with a wet towel. At the sampling days, fish was not fed, with 12 h of fasting. Thus, mercury concentrations in blood could be considered as the basal concentration on this biological matrix.
At the end of the experiment, the specimens were euthanized. Before this procedure, lidocaine was directly sprinkled in the gills of the specimens. After few minutes, if immobility and rigor mortis were observed, the specimens were dissected to separate muscles, liver and gonads samples. Every effort was made to minimize animal suffering, according to ethic code for research with animals (Ethic Committee from Fluminense Federal University approved this experiment, with protocol number 89/2011).
Blood analysis
Hemogram followed the methodology described by Almosny & Santos, where all cellular types are present in a Newbauer (Improved) chamber, being proceeded erythrocytes, thrombocytes and leukocytes counting together [33, 35]. Corpuscular volume (CV) was determined using capillary tubes submitted to centrifugation (12,000 rpm/5 min). The mean corpuscular volume (MCV) was calculated as follow: CV × 10/ Erythrocyte counting. Total plasmatic protein (TPP) was measure using a portable refractometer (BIOBRIX, model 301). The specific leukocytes counting was performed by using blood smears, fixed with methanol and stained in GIEMSA during 30 min. The identification of leukocytes was held in optical microscopy, using objective lens (1,000x) to estimate the frequency of each leukocyte type in 100 leukocytes, resulting in a percentage value.
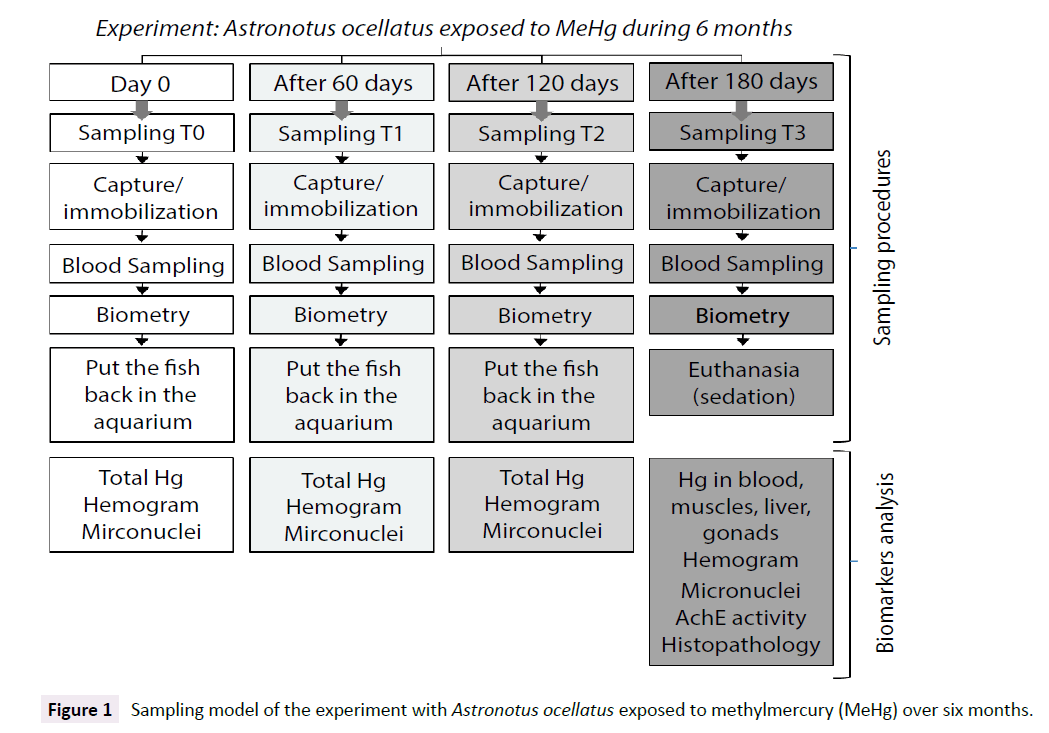
Figure 1: Sampling model of the experiment with Astronotus ocellatus exposed to methylmercury (MeHg) over six months.
Micronucleus frequency
The frequency of micronucleus was conducted on the same blood smears used for specific leukocytes counting. In optical microscopy, using the same objective lens (1,000x), the occurrence of micronucleus and bilobed nucleus in 1,000 erythrocytes for each specimen was counted. It was classified as micronucleus, every small fragment, non-refractory, with the same color and shape of the cell nucleus, from intact cells and as bilobed nucleus, every erythrocyte with nucleus in shape of beans.
Total mercury determination
Wet samples of muscles, liver and gonads were homogenized and the determinations were performed in triplicates. For each replicate, around 0.03 g of tissue was used. The blood samples were centrifuged (3,000 rpm/10 min) for separation of erythrocytes and other cells from plasma. The mercury determination on erythrocytes and on plasma was conducted in duplicates, because there was not sufficient sample mass. Total mercury was measured using a portable atomic absorption (LUMEX), specific for total mercury analysis by spectrophotometer. For this methodology, the samples were only homogenized. None previous treatment was necessary, since this equipment works with pyrolysis, where the samples were submitted to high temperatures (above 800°C) in a pyrolysis chamber, volatilizing mercury (all chemical forms) for its detection. The results are expressed as wet weight.
For accuracy evaluation, certified material (IEAE 407, mercury concentration=222 ng.g-1) analysis were performed every day, with an acceptable error of 10% (maximum). The detection limit was 5 ng.g-1. The mean value found for the certified material was 218.4 ± 14.3 ng.g-1 (n=90), resulting in an error of 1.8%. During international intercalibration of IAEA (International Atomic Energy Agency), the error was below 10%.
Acetylcholinesterase activities
The determinations of the AChE activity in fish muscles followed the method described by Oliveira Silva et al. with modifications, whose quantifications were based in the reaction described by Ellman et al. [36]. Small portions of muscle samples were weighted and homogenized in sodium phosphate 0.12 M, pH 7.6 (6:1). The samples were centrifuged (9,000 g, 20 min, 8°C). While the samples were centrifuging, test tubes were prepared containing 2 ml of sodium phosphate and 0.5 ml of DTNB 2 mm. At the time of lecture, 500 μl of acetylcholine and 25 μl of sample were added into those previously prepared tubes. Enzymatic activities were determined in spectrophotometer in kinetic form (λ=412 nm), being obtained after two minutes of reaction, the absorbance per minute. For protein determination, muscles samples were diluted (1:10) in sodium phosphate solution 0.12 M pH 7.6. In test tubes were added 4.3 ml of distilled H2O, 200 μl of NaOH 25% and 200 μl of diluted sample. The blank contained 4.5 ml of H2O distilled and 200 μl of NaOH 25%. In the first tube (blank) was added 300 μl of Folin reagent, being homogenized on a vortex during 30 s. The same process of homogenization was made to all tubes. After 5 min, the absorbance was measured in photometric model, in a spectrophotometer Shimadzu UV 1601 (λ=660 nm). The absorbance were converted to protein concentration (mg.ml-1) using an albumin curve. The specific activity of AChE (μmoles.min-1.mg-1 protein) was obtained by ratio of the enzyme activity and the protein concentration [37].
Histological analysis
Gonads and liver samples were obtained immediately after the specimen’s death and preserved on a solution of formaldehyde 10% buffered with sodium phosphate. After formaldehyde impregnation, the samples were carefully cut with sharp blades and positioned in the cassette. Next, the cassettes containing fragments of the samples were prepared for histological sections, according to Vazzoler [38]. All the prepared slides were observed on optical microscopy and the presence or the absence of any alteration was recorded for liver (presence of macro vacuoles, degeneration and necrosis, decrease on hepatocytes number, hyperplasia, inflammatory infiltration, hemorrhage, adiposities) and for gonads (atresic follicles, degeneration, hypertrophy, hyperplasia, inflammatory infiltration, primary and secondary follicles number, vacuolization, fibrosis).
Statistical analysis
The statistical analysis was performed using the software STATISTICA 8. Correlations between mercury concentrations and growth/effect biomarkers were tested using Spearman Test. Mann-Whitney U Test was applied to verify differences among test and control groups. The significance level accepted was at minimum p<0.05. For dependent samples variance evaluation, it was applied the Wilcoxon matched pairs test and the Friedman ANOVA and Kendall coefficient of concordance for multiple dependent samples. However its interpretation deserves attention, due to the low number of specimens used for this first experiment.
Results
The mean values of pH and water temperature of aquariums during the experiment period were, respectively, 6.2 ± 0.2 and 25 ± 2°C. During the experiment, 4 specimens died. At sampling T0 and T1, all specimens were alive. Between T1 and T2, we had the first three losses, one for control group and two for test group. The specimen from control group avoided food during more than three days and no clue of any kind of fish disease was observed during this period. Of the two deaths of test group, one specimen escaped from the aquarium during the night and the other one, there was a mechanical fail on the water pumping during the night and the water in the aquarium had no more circulation, decreasing dissolved oxygen. And finally between T2 and T3 samplings, we have lost one more specimen from test group.
Therefore, the results for each sampling correspond to this number of specimens: T0 and T1=3 specimens on control group and 8 on test group, T2=2 specimens on control group and 6 on test group, T3=2 specimens on control group and 5 on test group.
All the specimens have grown similarly (both control and test groups), indicating, initially, no influence of MeHg exposure on growth rates. Although, as we can see on Figure 2, there was a tendency of 10-20% of difference among control and test groups for weight and length, where control group showed slightly bigger specimens (Figure 2).
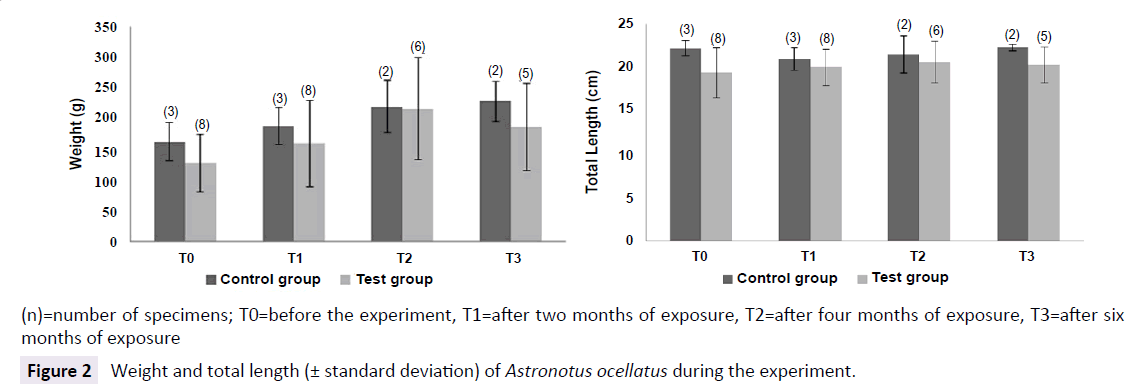
Figure 2: Weight and total length (± standard deviation) of Astronotus ocellatus during the experiment.
Mercury concentrations
The test group demonstrated a huge increase on mercury concentrations in blood at samplings T1 (Rank Sum: T0=36/T1=84, U: 0.0, Z: -3.24, p<0.005, valid cases: T0=8/T1=7), T2 (Rank Sum: T0=36/T2=69, U: 0.0, Z: -3.09, p<0.005, valid cases: T0=8/T2=6) and T3 (Rank Sum: T0=36/T1=4; U: 0.0, Z: -2.72, p<0.01, valid cases: T0=8/T1=4), when compared to the first sampling, with values 102 higher than control group (Rank Sum: Test Group=38/ Control Group=28, U: 2.0, Z: -2.04, p<0.05, valid cases: Test Group=8/Control Group=3). Control group did not show variation on mercury concentrations in blood during the experiment, being similar to T0. The results found in sampling T3 are shown in Table 1. All the analyzed tissues showed twice higher mercury concentrations than control group. Positive correlations were observed between mercury concentrations in erythrocytes and in muscles (0.83, p<0.05/0.9, p<0.05, respectively) and liver (0.77, p<0.05). The same way, it was observed correlation between mercury concentrations in liver and in muscles (0.96, p<0.001). These results suggest equilibrium on mercury distribution among fish tissues (Figure 3 and Table 1).
| Total Mercury (ng/g) |
Control Group |
Test Group |
| Muscles |
39.5 ± 31.8 (2) |
6,368.7 ± 1,089.3 (4) |
| Erythrocytes |
9.5 ± 6.4 (2) |
1,405.0 ± 121.2 (4) |
| Plasma |
20.0 (1) |
1,150.0 ± 139.0 (4) |
| Liver |
23.2 ± 3.9 (2) |
7,845.8 ± 439.6 (3) |
| Gonads |
32.0 (1) |
4,199.2 ± 1,504.0 (3) |
Table 1 Total mercury concentrations (wet weight, ng.g-1) in erythrocytes, plasma, muscles, liver and gonads of Astronotus ocellatus fed with artificially contaminated food with methylmercury (10 µg.g-1) after six months.
(n)=number of specimens collected at the end of the experiment.
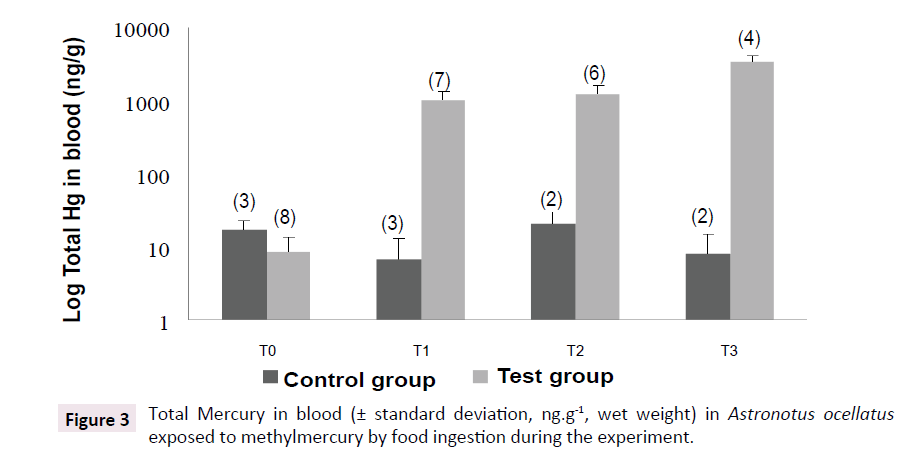
Figure 3:Total Mercury in blood (± standard deviation, ng.g-1, wet weight) in Astronotus ocellatus exposed to methylmercury by food ingestion during the experiment.
Hematology
There was a decrease on erythrocytes counting in the first two months of experiment for control group (Rank Sum: T0=15/T1=6, U: 0.0, Z: 1.96, p<0.05, valid cases: T0=3/T1=3). This decrease was also observed for test group, but during all the experiment, in other words, all the erythrocytes counting after the beginning of exposure were significantly different from T0 (Rank Sum: T0=90/T1=30, U: 2.0, Z: 3.01, p<0.005, valid cases: T0=8/T1=7) (Rank Sum: T0=82/T2=23, U: 2.0, Z: 2.84, p<0.005, valid cases: T0=8/T2=6) (Rank Sum: T0=59/T3=7, U: 1.0, Z: 2.25, p<0.05, valid cases: T0=8/T3=3). The haematocrit slightly decreased over the experiment on control group. Concerning differences between control and test groups, MCV was higher for specimens from test group (Rank Sum: Test Group=33/Control Group=3, U: 0.0, Z: 2.00, p<0.05, valid cases: Test=6/Control=2). This tendency can be corroborated with the found correlations (using data from the four samplings) between mercury concentrations in blood and erythrocytes counting (-0.48, p<0.01, n=29) and MCV (0.56, p<0.001, n=29), indicating that the exposure to MeHg could decrease erythrocytes counting and increase MCV, configuring a non-regenerative anemia scenario (Figure 4).
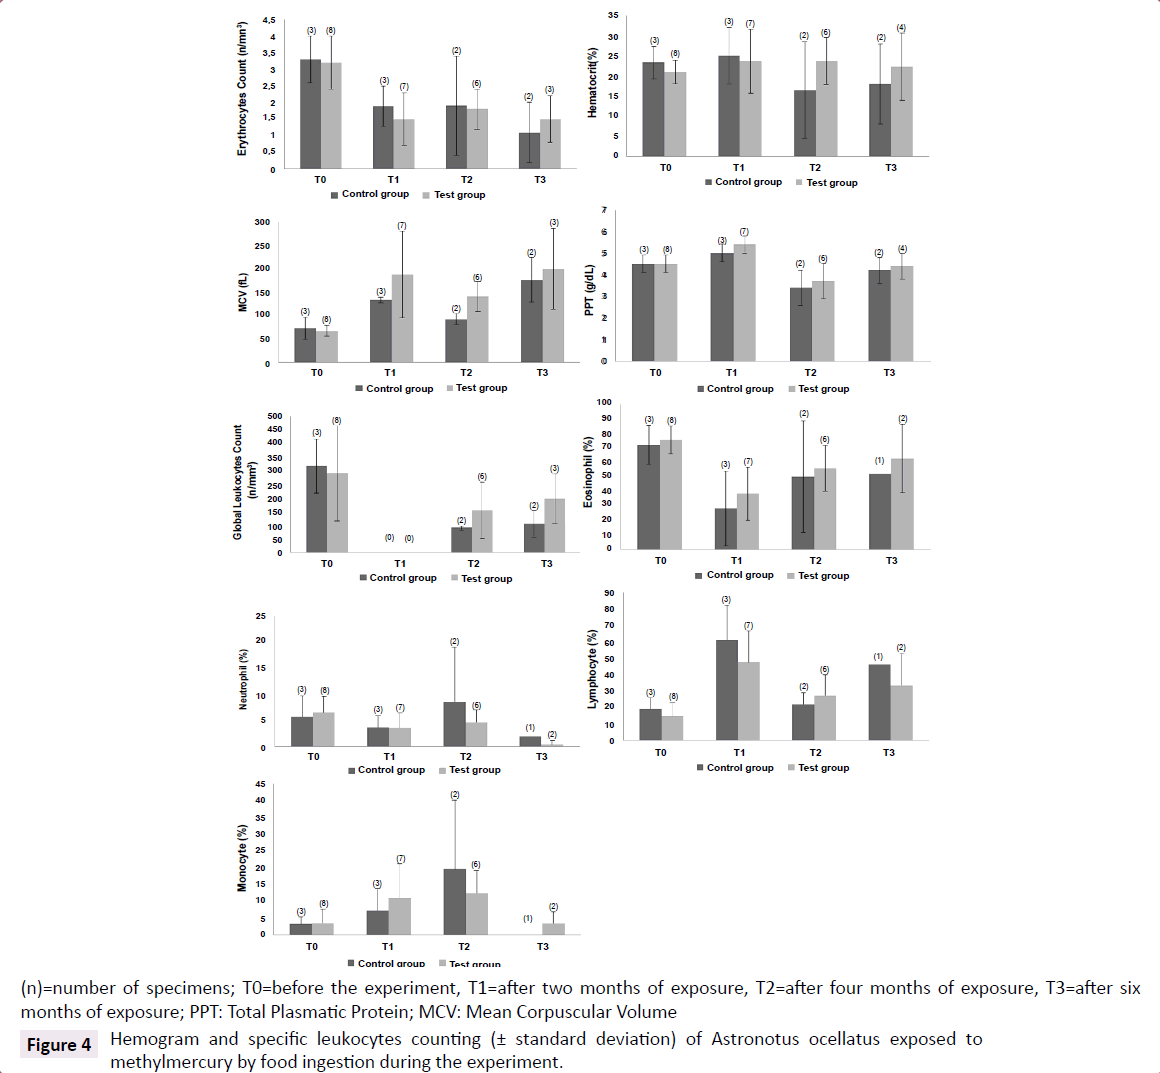
Figure 4:Hemogram and specific leukocytes counting (± standard deviation) of Astronotus ocellatus exposed to methylmercury by food ingestion during the experiment.
Furthermore higher frequencies of lymphocytes (Rank Sum: Test=39/Control=82, U: 2.0, Z: -3.01, p<0.005, valid cases: Test=8/ Control=7) and monocytes (Rank Sum: Test=47/Control=73, U: 11.0, Z: -1.96, p<0.05, valid cases: Test=8/Control=7) and lower frequency of eosinophil (Rank Sum: Test=90/Control=30, U: 2.0, Z: 3.01, p<0.005, valid cases: Test=8/Control=7) on test group were observed after two months of exposure. Correlations between the frequencies of eosinophil (-0.41, p<0.05, n=29) and monocytes (0.49, p<0.01, n=29) and mercury concentrations were found and could suggest a possible chronic monocytosis scenario and an increase on immunological reaction (Figure 4).
It’s also interesting to observe that, apparently at the sixth month of experiment, monocytes and eosinophils showed percentages similar to T0, but lymphocytes continued altered. And at T3, neutrophil started to decrease (Rank Sum: T0=52/T3=3, U: 0.0, Z: 2.09, p<0.05, valid cases: T0=8/T3=2).
Micronucleus frequency
Micronucleus frequency was basically none for all specimens along the experiment, except for T0, where it was found 1 micronucleus in 8,000 counted cells from test group, and for T2, where it was found 1 micronucleus in 2,000 counted erythrocytes from control group. Bilobed nucleus frequency was higher in test group that in control group, although it was not significantly different (Rank Sum: Test Group=56.5/Control group=9.5, U: 3.5, Z: 1.74, p=0.083, valid cases: Test group=8/control group=3). No correlation was found between mercury concentrations on any tissues and this effect biomarker. However, the bilobed nucleus frequency seemed to be interesting for chemical stress detection. May be it is necessary a higher exposure period to induce micronucleus formation in this fish species. The smears prepared during the last sampling were not used to investigate genotoxic effects, because they had no clean fields to performing the counting (Figure 5).
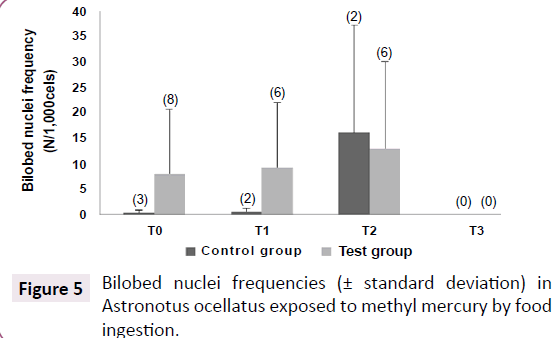
Figure 5:Bilobed nuclei frequencies (± standard deviation) in Astronotus ocellatus exposed to methyl mercury by food ingestion.
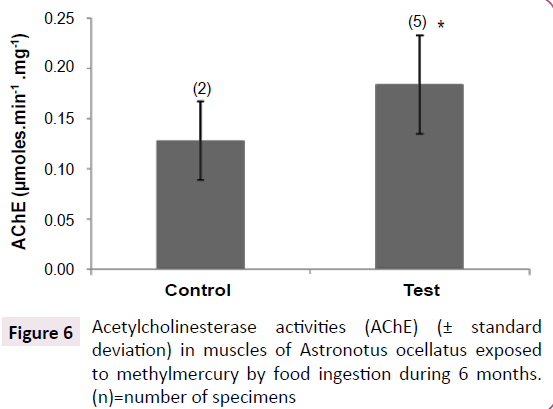
Figure 6:Acetylcholinesterase activities (AChE) (± standard deviation) in muscles of Astronotus ocellatus exposed to methylmercury by food ingestion during 6 months. (n)=number of specimens.
Acetylcholinesterase activity
The test group showed higher activities than control group (p<0.005), showing a possible activation of this enzyme after MeHg exposure (Figure 6).
Histopathology
It was observed for both test and control groups an increase on hepatocytes volume with vesicles formation, due to fat accumulation on liver. All fish specimens showed hepatocytes degeneration. This excessive fat accumulation could cause the observed degeneration on liver (hepatic lipidosis). For gonads analysis (three specimens from test group: Two females and one male), it was observed degeneration of cells in the male gonad, absence of spermatogonia, presence of young spermatozoa. On female gonads, it was observed hypertrophy and hyperplasia of the follicular layer and presence of follicular atresia, yolk degeneration and proteic material between cells, besides inflammatory infiltrate (Figure 7and Table 2).
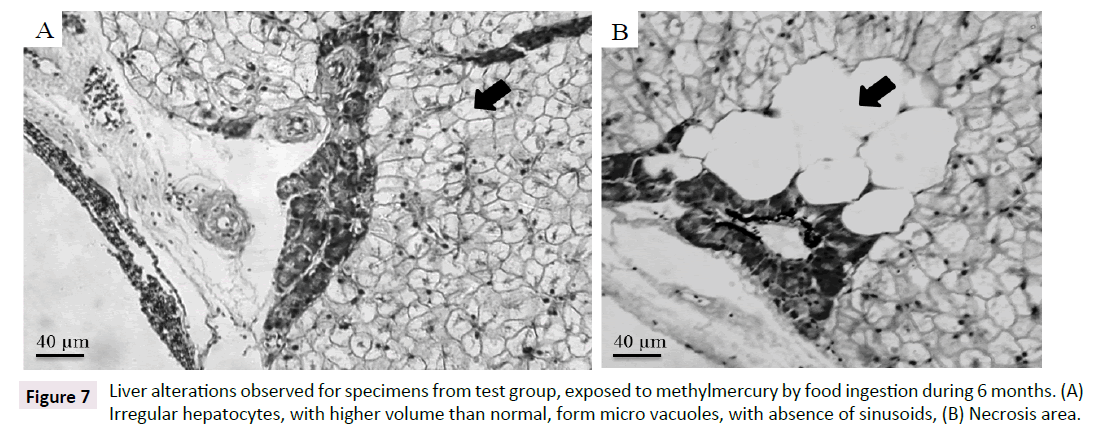
Figure 7:Liver alterations observed for specimens from test group, exposed to methylmercury by food ingestion during 6 months. (A) Irregular hepatocytes, with higher volume than normal, form micro vacuoles, with absence of sinusoids, (B) Necrosis area.
| Alterations |
C |
T |
T |
T |
T |
| Degeneration |
+ |
+ |
+ |
+ |
+ |
| Necrosis |
+ |
- |
- |
+ |
+ |
| Inflammatory infiltrate on hepatic parenchyma |
+ |
- |
- |
- |
- |
| Macrovasicles |
+ |
+ |
+ |
+ |
+ |
| Congestion of vessels |
- |
- |
- |
- |
+ |
C: specimen from control group (n=1); T: specimens from test group (n=4).
Table 2 Histological alterations in liver of Astronotus ocellatus fed with an artificially contaminated food with methylmercury (10 µg.g-1) after 6 months of exposure.
Individual analysis
As the experiment included few specimens, it’s interesting to describe the results found for biometry, mercury in blood, hematology and bilobed nuclei frequency along the six months of exposure. These biomarkers were chosen for this individual assessment, because they were measured throughout the experiment in all samplings (T0, T1, T2 and T3). Although micronuclei were also measured in all samplings, it was not observed an important variation during the experiment for all fish specimens. This analysis was only performed for the specimens that survived all the experiment (two from control group and six from test group) and for one specimen from test group that survived until the third sampling (Table 3).
| Specimen |
Weight
(g) |
Length
(cm) |
HgB
(ng/g) |
HgE
(ng/g) |
HgPl
(ng/g) |
EC
(n/mm3) |
GLC
(n/mm3) |
CV
(%) |
MCV
(fL) |
TPP
(g/dL) |
Eos
(%) |
Neu
(%) |
Lym
(%) |
Mon
(%) |
BN
(n/103) |
| Control group |
| C01 |
62, 0 |
-0, 6 |
-9, 0 |
-24, 5 |
- |
-3, 6 |
-335000, 0 |
-13, 0 |
151, 0 |
-1, 0 |
-10, 0 |
-6, 0 |
21, 0 |
-5, 0 |
1, 0 |
| C02 |
77, 7 |
0, 7 |
-9, 0 |
-22, 0 |
19, 0 |
-1, 4 |
-195000, 0 |
6, 0 |
81, 6 |
0, 0 |
-10, 0 |
0, 0 |
6, 0 |
4, 0 |
31, 0 |
| Test Group |
| T03 |
179, 2 |
0, 5 |
1648, 8 |
1845, 5 |
582, 6 |
-0, 6 |
-70000, 0 |
10, 0 |
54, 7 |
-0, 3 |
-13, 0 |
-1, 0 |
4, 0 |
10, 0 |
1, 0 |
| T04 |
60, 0 |
2, 0 |
3396, 0 |
1448, 0 |
1154, 3 |
-1, 5 |
-265000, 0 |
-10, 0 |
37, 1 |
0, 2 |
16, 0 |
-2, 0 |
-13, 0 |
-1, 0 |
1, 0 |
| T05 |
55, 0 |
0, 3 |
2669, 5 |
1287, 0 |
1017, 4 |
-2, 6 |
-5000, 0 |
9, 0 |
91, 9 |
0, 8 |
-31, 0 |
-3, 0 |
23, 0 |
11, 0 |
-1, 0 |
| T07 |
114, 8 |
0, 5 |
599, 3 |
- |
- |
-2, 7 |
-255000, 0 |
-5, 0 |
117, 8 |
-1, 8 |
-49, 0 |
0, 0 |
29, 0 |
22, 0 |
2, 0 |
| T09 |
50, 3 |
2, 0 |
3577, 7 |
1297, 9 |
1079, 0 |
-1, 5 |
-75000, 0 |
-2, 0 |
79, 4 |
-1, 4 |
-20, 0 |
-9, 0 |
35, 0 |
-6, 0 |
9, 0 |
| T10 |
55, 7 |
1, 6 |
4114, 0 |
1523, 0 |
1325, 0 |
-2, 7 |
-490000, 0 |
0, 0 |
229, 5 |
0, 6 |
-9, 0 |
-8, 0 |
18, 0 |
-1, 0 |
4, 0 |
* In gray, negative values
** In bold and italic font, comparisons calculated using the third sampling (four months of exposure-T2), not the fourth (six months of exposure-T3), because there was no result for that parameter at sampling T3
- = no values after exposure
HgB: Mercury Concentrations in Blood; HgE: Mercury Concentrations in Erythrocytes; HgPl: Mercury Concentrations in Plasma; EC: Erythrocytes Counting; GLC: Global Leukocytes Counting; CV: Corpuscular Volume; MCV: Mean Corpuscular Volume; TPP: Total Plasmatic Protein; Eos: Eosinophil Frequency; Neu: Neutrophil Frequency; Lym: Lymphocyte Frequency; Mon: Monocyte Frequency; BN: Bilobed Nucleus Frequency
Table 3 Oscillations (gains and losses) on biomarkers results observed for each specimen after six months of experiment (results before exposure subtracted from those after exposure).
From control group, the specimen named C01 gained weight linearly throughout the experiment (62.0 g). There was no clear relationship between mercury concentrations in blood and biometry. Also mercury concentrations in blood and in erythrocytes were 9 ng.g-1 and 24.5 ng.g-1, respectively, lower at the end of the experiment. Hematimetry decreased almost four times and CV was twice lower than the first sampling (T0). Consequently, the MCV increased. The total plasmatic protein decreased only 1.0 g.dl-1. There was a decrease on leukocytes number and an oscillation on their specific frequencies, with predominance of lymphocytes at T1, monocytes at T2 and lymphocytes/eosinophil at T3. One nuclear alteration was found at T1 and T2.
Also from control group, the specimen named C02 gained weight linearly throughout the experiment too (77.7 g). Also no clear relationship between mercury concentrations in blood and biometry and a decreasing on mercury concentrations in blood and in erythrocytes (9 ng.g-1 and 22.0 ng.g-1, respectively) were found. Hematimetry decreased only after six months (T3). Corpuscular volume or hematocrit increased at T1 and stabilized. MCV increased two times at T3. The oscillation on leukocytes frequencies was also observed, but with no monocytes predominance, only an exchange between lymphocytes and eosinophil predominance. And the number of leukocytes decreased, but not so expressive in comparison to C01. Nuclei abnormalities increased at T2.
For test group, the specimen named T03 gained 179.2 g and grew 0.5 cm. Obviously mercury concentrations in blood increased more than 1,600 ng.g-1. An expressive increase on mercury concentrations in erythrocytes was observed, almost four times higher than the increase on plasma. At the first two months, hematimetry had an extreme decrease, but then this counting came back to values very close to T0. So did the MCV, increasing at T1 and then coming back to the blank register (before exposure). Additionally lymphocytes predominated as leukocyte type only after two months of exposure. At T2, appeared one bilobed nucleus in the counting.
The specimen named T04 gained 60.0 g and grew 2.0 cm. No growth was observed between T1 and T2. The relationship between mercury concentrations in blood and length is cleaner. The majority of expressive differences on hematology was observed at T1 (after two months of exposure), where PPT, CV and MCV increased and lymphocytes had higher frequency than eosinophils. Bilobed nuclei were similar, increasing in only one alteration at T2 in comparison to T0.
Fish number T05 gained 55.0 g and grew 0.3 cm. After two months of exposure, hematimetry decreased and CV and MCV increased. Then their values came back to those observed for T0. Between the third and the last sampling, this specimen lost weight; mercury concentrations in erythrocytes and in plasma were quite similar, being the ratio 1.3:1 and TPP increased. In this specimen, no nuclei abnormalities were found at the end of the experiment.
T07 gained 114.8 g and grew 0.5 cm. At the first four months, hematimetry was lower than before exposure. CV had an oscillation, increasing in the first moment (T1) and then decreasing (T2). MCV increased until T2. TPP decreased after four months of exposure (T2). Lymphocytes had higher frequencies than eosinophils until the third sampling (T2). The number of nucleus alterations found at T2 was twice higher than at T0.
T09 gained 50.3 g and grew 2.0 cm. Weight lost was also observed between T2-T3 samplings. Similar to the specimen T05, the ratio between mercury concentrations in erythrocytes and plasma was close to 1 (1.2:1). Oscillation on hematimetry was observed, with an increase at T2 and a decrease at T1 and T3, in comparison to T0. CV and MCV increased after four months of exposure (T2) and TPP decreased. In this specimen was observed a significant difference on monocytes frequency at T1, where eosinophils decreased, but lymphocytes were not predominant. At sampling T2, a condition near to T0 was observed, where eosinophils predominated after the decreasing on lymphocytes and monocytes frequencies. At the end of the experiment (T3), lymphocytes increased again, but not followed by monocytes, being predominant. This specimen had the highest increase on bilobed nucleus frequency, having 8 abnormalities more than at T0.
The last specimen, T10, gained 55.7 g and grew 1.6 cm, showing the best length: Weight relationship. In this specimen, hematimetry decreased during all the experiment, but CV decreased only at the first two months. After that CV increased until the end of the experiment. MCV increase throughout the experiment and showed, apparently, a positive relationship with mercury concentrations in blood, following mercury increasing. TPP oscillated, showing higher concentrations at T1 and T3 and lower concentration in T2, in comparison to T0. At the first two months, lymphocytes predominated, including an increase on monocytes frequency too. After that, eosinophils were the most frequent leukocyte type found. This specimen had high frequencies of nucleus abnormalities since the beginning, showing four more bilobed nuclei at T2 in comparison to T0.
Overall, test group, besides the massive difference on mercury concentrations after the beginning of exposure (Friedman Anova, n=3, df=3, 8.2, p<0.05), showed a tendency of increase on CV, while for the control group the CV decreased. Also, the variation on specific leukocytes count was clear and stronger on test group, especially for monocytes, which increased for test group, but decreased on control group. Comparing only the beginning and the fourth month of exposure (T0 and T3 samplings, respectively), besides biometry (Wilcoxon, n=5, T=0.0, Z=2.02, p<0.05) and mercury concentrations in blood (Wilcoxon, n=5, T=0.0, Z=2.02, p<0.05), it was observed a significant difference for erythrocytes count, global leukometry and mean corpuscular volume (Wilcoxon, n=5, T=0.0, Z=2.02, p<0.05), corroborating the description mentioned above for each individual of test group. For this individual analysis, statistical tests were not applied to control group due to the low number of specimens that survived until the end of the experiment (n=2) (Table 3).
Discussion
Some field works use the ratio of MeHg concentrations in muscles and liver to evaluate a possible equilibrium of mercury concentrations in fish [39, 40]. They suggest that a ratio between 1.0-1.5 would indicate equilibrium and stability. In this work, the concentrations on muscles were lower than in the liver (Hg Muscles: Hg Liver=0.81), being at a non-equilibrium state. This was expected since liver is an important organ for detoxication and also it is one of the first organs in contact to xenobiotics such as methylmercury. Mela et al. also found lower mercury concentrations in muscles (4.77 ± 1.99 μg g-1) than in liver (8.26 ± 6.45 μg g-1) for a neotropical fish species (Hoplias malabaricus) exposed by contaminated food ingestion during 70 days with a similar dose of the present work (10.5 μg g-1), presenting a ratio of 0.58 [41]. Mercury concentrations in erythrocytes were four times lower than those found in muscles, indicating a high methylmercury accumulation rate. The ratio found for mercury concentrations in erythrocytes and plasma was 1.22. It was expected a higher ratio since that methylmercury has higher affinity for erythrocytes, according to iron and sulfur concentrations in these cells [42]. Rodrigues et al. found for a wildlife catfish (Genidens genidens) a ratio of 6:1 [1].
The apparent tendency of decrease on erythrocytes counting and on total plasmatic protein over the time, for both groups, were inconclusive, since they could be linked to the long period of permanence of these species in aquarium or even physiological variations, due to age and spawning period. It was observed that all the specimens in the last months have chosen specific places at the aquarium to clean the bottom and starts incubation of eggs, even without physical or visual contact with other individuals.
Among the observed effects, it was described a non-regenerative anemia scenario for specimens from test group. This same scenario was observed for tucunarés (Cichla sp.) from ASSGM areas, extremely contaminated with mercury in Tapajós River, Amazon, Brazil and for a catfish species (Genidens genidens) from Guanabara Bay, Rio de Janeiro, Brazil [1, 32]. In this respect, Castilhos et al. suggested that mercury could be directly involved in ionic equilibrium, increasing the cell volume [32]. According to Lohner et al., methylmercury could be involved on the erythrocytes turn over, inducing anemia in fish specimens [43]. Also, the negative correlation between mercury concentrations on erythrocytes and erythrocytes counting can suggest a chemical stress inducing lower number of erythrocytes.
For specific leukometry, it is common to have higher lymphocytes frequency and lower proportions of other leucocytes types [44]. However, in this study, for both test and control groups, eosinophils were predominant. After exposure, for test group, lymphocytes frequency oscillated, being predominant at some samplings. Higher frequencies of eosinophil and monocytes were correlated to mercury concentrations, suggesting a possible chronic monocytosis scenario and an increase on immunological reaction. The eosinophil does not have a well delimited function in fish, but it is believed that it is associated to defense against parasites and it is important on a post-inflammatory scenario, being related to phagocytosis of bacteria [44]. Ribeiro et al. on the other hand, observed an increase on erythrocytes number and on corpuscular volume, for another neotropical fish species (Hoplias malabaricus) fed with an MeHg artificially contaminated food during 70 days with a similar dose of the present work (10.5 μg g-1) [45]. Also the authors described an increase on neutrophil and a decrease on monocytes frequencies.
The micronucleus frequency is related to haematopoiesis, performed by kidneys in fish. If the kidney presents a dysfunction, errors during cell division or new erythrocytes formation are expected. During tests in laboratory conditions, the interval between exposure to a xenobiotic and the initial detection of micronucleus frequency increase is related to the erythrocytes half-life, being substituted by new ones after few days of exposure. These new erythrocytes have higher errors rates during mitosis [46]. Sanchez-Galan et al. demonstrated that both cadmium and mercury could induce micronucleus formation in eels after intraperitonial injections (1.7 mg of metal per Kg of specimen’ weight), observing a frequency of 2.64 and 2.35 micronucleus per 1,000 erythrocytes, respectively [47]. Vicari et al. did not found a clear induction of micronuclei or another abnormalities for Hoplias malabaricus fed with an MeHg artificially contaminated food during 70 days with a similar dose of the present work (10.5 μg g-1) [48].
Porto et al. found significantly higher frequencies of micronucleus in Prochilodus nigricans (detritivorous species), Mylossoma duriventris (omnivorous species) and Hoplias malabaricus (piscivorous species) from Madeira River, a highly contaminated area by ASSGM activities on Amazon Region, compared to frequencies in specimens from Solimões River [49]. Moreover, micronucleus frequency was five times higher in Hoplias malabaricus than in the other two species, which was suggested due to higher mercury levels resulted of its food habit. However, Castilhos et al. did not find differences on micronucleus frequencies comparing a ASSGM site on Tapajós River and a reference area, also from Amazon Region, for Cichla sp. [32].
Souto has found positive correlation between mercury in muscles and acetylcholinesterase activity for Cichla sp. [50]. from ASSGM areas at Amazon Basin. In laboratory assays, its activity in brain, gills and liver was inhibited due to mercury exposure, but no inhibition was found in muscles [51]. Costa et al. registered a reduction of 36% on muscle ChE activity for Hoplias malabaricus fed with a MeHg artificially contaminated food during 70 days (dose=0.075 μg g-1) [30]. Other authors have not found this direct relationship between mercury and acetylcholinesterase in muscles, which may be linked to differences on metabolism, including different isoforms of the cholinesterase group [52, 53].
Magnotti et al. reported the occurrence of important differences between acetylcholinesterase types in several fish species [52]. They suggested the existence of two groups of AChE, one with higher activity and the other with lower activity. Differences on acetylcholinesterase sensibility were reported previously for fish and they are linked to many factors, such as the ability of the enzyme’s active site to join the alkyl chain of a substrate like acetylcholine and butyrylthiocholine iodides [54].
Regarding the observed effects on histology, lipidosis can occur due to long periods of fasting or high fat percentage on food. However, this could be a natural characteristic of this fish species, especially during adult life, during reproduction period. Lipid bodies were sporadically visible in the cytoplasm of hepatocytes on control group of the experiment described by Mela et al. for Hoplias malabaricus fed with a MeHg artificially contaminated food during 70 days [55]. Additionally, the authors reported macrophage aggregates and necrosis areas, the presence of atypical cytoplasmic electron dense granules within hepatocytes and of melanomacrophage centers, and high vacuolization of the endothelial cells in H. malabaricus liver. Despite the reduced number of specimens for histological analysis, fish from test group showed severe damages on gonads, which could prejudice their reproduction inevitably, in case of high doses of methyl mercury exposure on wildlife.
Context in wild fish populations
As this experiment was carried out using a high dose with a long time pattern, it is also interesting to discuss the expected exposure concentrations of this and other fish species to methylmercury in natural conditions and their health responses. Astronotus ocellatus occurs naturally on the Amazon River basin, including registers in Peru, Colombia and Brazil. However this species can occur as an invasive exotic species at aquatic systems. There is only one published study that includes mercury contamination assessment using A. ocellatus, but it was held at a Amazonian lake (Manacapuru Great Lake), located at the drainage basin of Solimões River, with no contamination or anthropogenic source of mercury [56]. Then the observed mercury concentrations in muscles were low (134.2 ± 113.9 ng.g-1), even for piscivorous species. About the effects in this species in wildlife due to mercury exposure, there is no published data available for comparison.
Although for most natural areas it is not expected such high doses, previous works demonstrated that fish are easily exposed to high mercury doses in old ASSGM areas in Brazilian Amazon, where A. ocellatus species occurs. For example, at Tapajós River and its tributaries show mercury concentrations in sediments and in suspended solids between 10-1 and 101 μg.g-1, being mercury concentrations in the organic matter content of these suspended solids until 101 μg.g-1 and in planktonic organisms between 101 and 103 μg.g-1 [57, 58]. These are initial concentrations in the trophic chain base, which is able to increase 104-105, or more, considering piscivorous fish species, even in non-contaminated areas [59]. Castilhos et al. estimated a daily dose of 0.8 ng.g-1.day- 1 for Cichla sp. from Tapajós River [59].
Overall, a study at an ASSGM area located at one tributary of the Tapajós River, found extremely high mercury concentrations in muscles of a carnivorous species-Hoplias malabaricus (Erythrinidae) (6.11 ± 5.93 μg.g-1, n=20), reaching the maximum of 21.9 μg.g-1, which compared to our experiment, showed quite similar mercury concentrations in muscles [8]. Regarding methylmercury exposure specifically, Huang et al. observed a range of 79.6-100.0% for methylmercury in muscles of 15 Amazonian fish species. Castilhos et al. found about 84.4% of methylmercury in muscles of H. malabaricus. For Cichla sp., from the same family of A. ocellatus, the percentage is even higher about 96.6% [8, 60]. Then, one could suggest that results from this bioassay may be fit with some actual mercury exposure conditions in the field.
Concerning the effect biomarkers, we decided to compare our results with two studies developed in Tapajós River Basin, in some ASSGM sites [32, 61]. The first study was held in 2001, where specimens of Cichla sp. were collected at Tapajós River (near to Itaituba city-an ASSGM site) and at Maicá Lake (Santarém city-a reference area) [33]. The authors described higher MCV and lower erythrocyte count, corpuscular volume and leukocyte count at the contaminated area, all correlated to mercury concentrations, suggesting a non-regenerative anemia and a deficiency on immunological system caused by mercury exposure. Additionally, granulocytes (eosinophil and neutrophil) (55.8 ± 15.1%) were lower at Itaituba City, whereas lymphocytes (31.0 ± 15.3%) and monocytes (13.4 ± 8.6%) were higher comparing to the reference area. Also lymphocytes were not the prevalent leukocyte type [62] (Table 4).
| Area |
ASSGM |
HgM |
Lenght |
EC |
CV |
MCV |
GL |
References |
| Hoplias malabaricus(Erythrinidae): Carnivorous |
| São Chico |
Present |
7.71 ± 6.20
(9) |
24.1 ± 7.2 (9) |
2.2 ± 0.4
(7) |
26.9 ± 5.5 (7) |
123.4 ± 15.4
(7) |
- |
Castilhos et al. 2004b |
| Creporizinho |
Present |
0.73 ± 0.43
(4) |
18.6 ± 9.8 (4) |
2.8 ± 0.4
(4) |
40.7 ± 5.2
(4) |
148.9 ± 26.5
(4) |
- |
Castilhos et al. 2004b |
| Caquetaia spectabilis (Cichlidae): Omnivorous |
| São Chico |
Present |
2.16±1.02
(18) |
8.2±0.6
(18) |
1.9±0.3
(17) |
24.8±4.0
(18) |
128.4±19.5
(17) |
- |
Castilhos et al. 2004b |
| Creporizinho |
Present |
0.42±0.26
(11) |
8.7±0.8
(11) |
2.1±0.2
(11) |
29.3±3.1
(11) |
141.7±18.0
(11) |
- |
Castilhos et al. 2004b |
| Cichla sp (Cichlidae): Carnivorous |
| Santarém |
Absent |
0.24±0.11
(53) |
30.2±3.9
(55) |
2.7±0.6
(34) |
44.4±8.1
(35) |
183.1±36.7
(35) |
53.2±11.2
(31) |
Castilhos et al. 2004a |
| Jacareacanga / Itaituba |
Present |
0.71±0.22
(55) |
30.0±6.7
(56) |
2.0±0.4
(53) |
40.3±5.6
(51) |
211.5±41.4
(49) |
36.2±10.0
(49) |
Castilhos et al. 2004a |
| Astronotus ocellatus (Cichlidae): Omnivorous |
| Bioassays |
Artificial exposure |
6.39±1.09
(4) |
20.3±2.1 (5) |
1.5±0.7 (3) |
22.3±8.3 (4) |
199.5±86.2 (3) |
196.7±90.7 (3) |
Present Study |
HgM: Mercury Concentrations in Muscles; EC: Erythrocytes Counting (106 mm3); CV: Corpuscular Volume (%); MCV: Mean Corpuscular Volume (fL); GL: Global Leukometry (103 mm3).
Table 4 Total mercury in muscles (µg.g-1) and hematological parameters of different fish species from artisanal small-scale gold mining (ASSGM) areas and a reference area (without mining activities), from Tapajos River Basin, Amazon, Brazil [61].
The second study was held in 2003, at two study areas: São Chico and Creporizinho ASSGM sites [60]. The authors evaluated mercury exposure and hematological alterations on fish from tributaries of Tapajós River, using one carnivorous species, Hoplias malabaricus and one omnivorous, Caquetaia spectabilis (Cichlidae). Both species had lower corpuscular volume, erythrocytes count and mean corpuscular volume at São Chico mining site, where the specimens also showed higher mercury concentrations in muscles, suggesting a regenerative anemia. Besides, mercury levels and corpuscular volume showed significant negative correlation for both species (H. malabaricus: -0.82, p<0.005 n=11, C. spectabilis: -0.37, p<0.05 n=29).
The same pattern of hematological response was observed for the test group of this bioassay and it is clear that the observed effects on wildlife specimens were reproduced on a smaller scale, in laboratory conditions, reinforcing the relationship between environmental exposure to mercury and biological effects observed on field work.
Conclusion
Concluding, mercury bioaccumulation was clearly observed in all fish tissues (102) and several effects were observed in A. ocellatus due to methylmercury exposure, including: decrease in erythrocytes number, increase in corpuscular volume and in monocytes frequency, increase in hepatocytes volume and their degeneration, hypertrophy and hyperplasia of follicular layer, increase in follicular atresia, yolk degeneration and presence of proteic material and inflammatory infiltrate on liver and gonads. Genotoxic effects were not clear and the acetylcholinesterase activity seemed to be higher after exposure. A study at ASGM found mercury concentrations in muscles quite similar of this present bioassay, which permits to suggest that this bioassay could be fit well with some actual wildlife mercury exposure conditions. Since these are the first data for methylmercury exposure of an Amazon fish species kept in laboratory for a chronic experiment (with 180 days of duration, observing juveniles until adult age), more tests are necessary to understand methylmercury non-lethal effects on Astronotus ocellatus. Future steps include rising the number of specimens and doses to observe the reproducibility of these results and to perform a dose response relationship analysis.
Acknowledgement
The authors would like to thank Prof. Renato Clapp (Fluminense Federal University, Veterinary School), for offer a part of his laboratory physical space to us, allowing this experiment to be done, to FIOCRUZ (Oswaldo Cruz Foundation), where we made the fish food contamination, to CAPES (Coordination for the Improvement of Higher Level or Education Personnel), for the financial support, and all the veterinary students that helped during the experiment and samplings.
References
- Rodrigues APC, Maciel PO, Pereira da Silva LCC, Albuquerque C, Inácio AF, et al. (2010) Biomarkers for mercury exposure in tropical estuarine fish. J Braz Soc Ecotoxicol 5: 9-18.
- Lee JW, Kim JW, Riu N, Moniello G, Hung SSO (2012) Histopathological alterations of juvenile green (Acipenser medirostris) and white sturgeon (Acipenser transmontanus) exposed to graded levels of dietary methylmercury. Aquat Toxicol 109: 90-99.
- Cesar R, Natal-da-Luz T, Silva F, Bidone E, Castilhos Z, et al. (2015) Ecotoxicological assessment of a dredged sediment using bioassays with three species of soil invertebrates. Ecotoxicol 24: 414-423.
- Landis WG, Yu Ming-Ho (1995) Introduction to environmental toxicology-Impacts of chemical upon ecological systems. Lewis Publishers, Florida.
- (1994) Agency for toxic substances and disease registry toxicological profile. US Department of Health and Human Services, TP-93/05, Atlanta, GA.
- Ruelas-Inzunza J, Meza-López G, Páez-Osun F (2008) Mercury in fish that are of dietary importance from the coasts of Sinaloa (SE Gulf of California). J Food Compos Anal 21: 211-218.
- Berntssen MHG, Hylland K, Julshamn K, Lundebye AK, Waagbo R (2004) Maximum limits of organic and inorganic mercury in fish feed. Aquac Nutr 10: 83-97.
- Castilhos ZC, Rodrigues-Filho S, Cesar R, Rodrigues AP, Villas-Boas R, et al. (2015) Human exposure and risk assessment associated with mercury contamination in artisanal gold mining areas in the Brazilian Amazon. Environ Sci Pollut Res 22: 11255-11264.
- WHO (1990) Environmental health criteria (EHC 101). Methylmercury. Geneva. 143.
- Sandheinrich MB, Miller KM (2006) Effects of dietary methylmercury on reproductive behavior of fathead minnows (Pimephales promelas). Environ Toxicol Chem 25: 3053-3057.
- Hammerschmitd CR, Sandheinrich MB, Wiener JG, Rada RG (2002) Effects of dietary MeHg on reproduction of fathead minnows. Environ Sci Technol 36: 877-883.
- Drevnick PE, Sandheinrich MB, Oris JT (2006) Increased ovarian follicular apoptosis in fathead minnows (Pimephales promelas) exposed to dietary methylmercury. Aquat Toxicol 79: 49-54.
- Drevnick PE, Sandheinrich MB (2003) Effects of dietary methylmercury on reproductive endocrinology of fathead minnows. Environ Sci Technol 37: 4390-4396.
- Hammerschmitd CR, Sandheinrich MB (2005) Maternal diet during oogenesis is the major source of methylmercury in fish embryos. Environ Sci Technol 39: 3580-3584.
- Wiener JG, Spry DJ (1996) Toxicological significance of mercury in freshwater fish. In: Beyer WN, Heinz GH, Redmon-Norwood AW (Eds) Environmental contaminants in wildlife: Interpreting tissue concentrations, Lewis Publishers, Florida. 297-339.
- Mckim JM, Olson GF, Holcombe GW, Hunt EP (1976) Long-term effects of methylmercury chloride on three generations of brook trout (Salvelinus fontinalis): Toxicity, accumulation, distribution and elimination. J Fish Res Board Can 33: 2726-2739.
- Friedmann AS, Watzin MC, Brinck-Johnsen T, Leiter JC (1996) Low levels of dietary methylmercury inhibits growth and gonadal development in juvenile walleye (Stizostedion vitreum). Aquat Toxicol 35: 265-278.
- Latif MA, Bodaly RA, Johnston TA, Fudge RJP (2001) Effects of environmental and maternally derived methylmercury on the embryonic and larval stages of walley (Stizostedion vitreum). Environ Pollut 111: 139-148.
- Moretto MB, Lermen CL, Morsch VM, Bohrer D, Ineu RF, et al. (2004) Effect of subchronic treatment with mercury chloride on NTPDase, 5'-nucleotidase and acetylcholinesterase from cerebral cortex of rats. J Trace Elem Med Biol 17: 255-260.
- Lavado R, Ureña R, Martin-Skilton R, Torreblanca A, Del Ramo J, et al. (2006) The combined use of chemical and biochemical markers to assess water quality along the Ebro River Ramo. Environ Pollut 139: 330-339.
- Guimarães ATB, Silva de Assis HC, Boeger W (2007) The effect of trichlorfon on acetylcholinesterase activity and histopathology of cultivated fish Oreochromis niloticus. Ecotoxicol Environ Saf 68: 57-62.
- Fonseca MB, Glusczak L, Moraes BS, Menezes CC, Pretto A, et al. (2008) The 2,4-D herbicide effects on acetylcholinesterase activity and metabolic parameters of piava freshwater fish (Leporinus obtusidens). Ecotoxicol Environ Saf 69: 416-420.
- Franciscato FR, Goulart NM, Lovatto FA, Duarte EMM, Flores VL, et al. (2009) ZnCl2 exposure protects against behavioral and acetylcholinesterase changes induced by HgCl2. Int J Devl Neurosci 27: 459-468.
- Vieira LR, Gravato C, Soares AM, Morgado F, Guilhermino L (2009) Acute effects of copper and mercury on the estuarine fish Pomatoschistus microps: linking biomarkers to behavior. Chemosphere 76: 1416-1427.
- Richetti SK, Rosemberg DB, Ventura-Lima J, Monserrat JM, Bogo MR, et al. (2011) Acetylcholinesterase activity and antioxidant capacity of zebra fish brain is altered by heavy metal exposure. Neurotoxicol 32: 116-122.
- Lima D, Roque GM, Almeida EA (2013) In vitro and in vivo inhibition of acetylcholinesterase and carboxylesterase by metals in zebra fish (Danio rerio). Mar Environ Res 91: 45-51.
- Shukor MY, Tham LG, Halmi MI, Khalid I, Begum G, et al. (2013) Development of an inhibitive assay using commercial Electrophorus electricus acetylcholinesterase for heavy metal detection. J Environ Biol 34: 967-970.
- Jesus TB, Almeida PGA, Vergílio CS, Machado ALS, Carvalho CEV (2011) Acute intraperitoneal mercury chloride contamination and distribution in liver, muscle and gill of a neotropical fish Hoplias malabaricus. Braz Arch Biol Technol 54: 379-386.
- Jesus TB, Colombi JS, Ribeiro CAO, de Assis HCS, de Carvalho CEV (2013) Cholinestarase activity in methylmercury and mercury chloride exposure fish. Ecotoxicol Environ Contam 8: 147-148.
- Costa JRMA, Mela M, Assis HCS, Pelletier E, Randia MAF, et al. (2007) Enzymatic inhibition and morphological changes in Hoplias malabaricus from dietary exposure to lead (II) or methylmercury. Ecotoxicol Environ Saf 67: 82-88.
- Castilhos ZC, Almosny N, Souto PS, Pereira da Silva LCC, Bidone ED (2003) Temporal and spatial bioassessment of ecological risk of amazonian itchyofauna associated to Hg exposure. J Phys IV France 107: 267-270.
- Castilhos ZC, Almonsy N, Souto PS, Pereira da Silva LCC, Linde AR, et al. (2004a) Bioassessment of ecological risk of amazonian ichthyofauna to mercury. Bull Environ Contam Toxicol 72: 671-679.
- Almosny NRP, Santos L (2001) Laboratory support in wild animal medicine. In: Fowler M, Cubas Z (Eds) Biology, medicine and surgery of South American wild animals, Iowa State University Press, Iowa. 500-505.
- Campbell TW (2004) Hematology of fish. In: Thrall MA, Weiser G, Allison R (Eds) Veterinary hematology and clinical chemistry, 1st edition, Wiley-Blackwell, New York. 277-289.
- Oliveira-Silva JJ, Alves SR, Inácio AF, Meyer A, Sarcinelli PN, et al. (2000) Cholinesterase activities determination in frozen blood samples: An improvement to the occupational monitoring in developing countries. Hum Exp Toxicol 19: 173-177.
- Elmann GL, Courtney K, Andres JA, Featherstone R (1961) A new and rapid colorimetric determination of acetylcholinesterase activity. Biochem Pharmacol 7: 89-95.
- Cunha JB, Lima JS, Faria MVC (1991) Brain acetylcholinesterase as an in vitro detector of organophosphorus and carbamate insecticides in water. Water Res 25: 835-840.
- Vazzoler AEAM (1981) Manual de métodos para estudos biológicos de populações de peixes – reprodução e crescimento. Programa Nacional de Zoologia, Brasília.
- Lasorsa B, Allen-Gil S (1995) The methylmercury to total mercury ratio in selected marine, freshwater and terrestrial organisms. Water Air Soil Pollut 80: 905-913.
- Downs SG, Macleod CL, Jarvis K, Birkett JW, Lester JN (1999) Comparison of mercury bioaccumulation in eel (Anguilla anguilla) and roach (Rutilus rutilus) from river systems in East Anglia, UK. Environ Technol 20: 1189-1200.
- Mela M, Neto FF, Yamamoto FY, Almeida R, Grotzner SR, et al. (2014) Mercury distribution in target organs and biochemical responses after subchronic and trophic exposure to Neotropical fish Hoplias malabaricus. Fish Physiol Biochem 40: 245-256.
- Ribeyre F, Boudou A (1984) Bioaccumulation et tepartition tissulaire du mercure-HgCl2 et CH3HgCl-CHES Salmo gairdneri apres contamination par voie directe. Water Air Soil Pollut 23: 169-186.
- Lohner TW, Reash RJ, Willet VE, Rose LA (2001) Assessment of tolerant sunfish populations (Lepomis sp.) inhabiting selenium-laden coal ash effluents. Ecotoxicol Environ Saf 50: 203-216.
- Tavares-Dias M, Moraes FR (2004) Hematologia de peixes teleósteos. Villimpress Complexo Gráfico, Ribeirão Preto.
- Ribeiro CAO, Neto FF, Mela M, Silva PH, Randi MAF, et al. (2006) Hematological findings in neotropical fish Hoplias malabaricus exposed to subchronic and dietary doses of methylmercury, inorganic lead and tributyltin chloride. Environ Research 101: 74–80.
- Grisolia CK, Cordeiro CMT (2000) Variability in micronucleus induction with different mutagens applied to several species of fish. Genet Mol Biol 23: 235-239.
- Sanchez-Galan S, Linde AN, Ayllon F, Garcia-Vazquez E (2001) Induction of micronuclei in Eel (Anguilla anguilla L.) by heavy metals. Ecotoxicol Environ Saf 49: 139-143.
- Vicari T, Ferraro MVM, Ramsdorf WA, Mela M, Ribeiro CAO, et al. (2012) Genotoxic evaluation of different doses of methylmercury (CH3Hg+) in Hoplias malabaricus. Ecotoxicol Environ Saf 82: 47-55.
- Porto JIR, Araujo CSO, Feldberg E (2005) Mutagenic effects of mercury pollution as revealed by micronucleus test on three Amazonian fish species. Environ Res 97: 287-292.
- Souto PS (2004) Risco ecológico associado a contaminação mercurial em ecossistemas aquáticos da Amazônia: Região do rio Tapajós, Estado do Pará, Brasil. Caracterização através de biomarcadores no gênero Cichla (tucunarés). Thesis, Fluminense Federal University.
- Gill T, Tewari H, Pande J (1990) Use of the fish enzyme system in monitoring water quality: Effects of mercury on tissue enzymes. Comp Biochem Physiol 97: 287-292.
- Magnotti RA, Zaino JP, McConnell RS (1994) Pesticide-sensitive fish muscle cholinesterases. Comp Biochem Physiol Part C Toxicol Pharmcol 108: 187-194.
- Oliveira MM, Silvafilho MV, Bastos VLFC, Fernandes FC, Bastos JC (2007) Brain acetylcholinesterase as a marine pesticide biomarker using Brazilian fishes. Mar Environ Res 63: 303-312.
- Monserrat JM, Martínez PE, Geracitano LA, Amado LL, Martins CMG, et al. (2007) Pollution biomarkers in estuarine animals: Critical review and new perspectives. Comp Biochem Physiol 146: 221–234.
- Mela M, Randia MAF, Ventura DF, Carvalho CEV, Pelletier E, et al. (2007) Effects of dietary methylmercury on liver and kidney histology in the neotropical fish Hoplias malabaricus. Ecotoxicol Environ Saf 68: 426-435.
- Beltran-Pedreros S (2012) Mercúrio em componentes bióticos e abióticos do Lago Grande de Manacapuru, Amazonas. Thesis, Amazonas Federal University.
- Rodrigues RM, Mascarenhas AFS, Ichihara AH, Souza TMC, Bidone ED, et al. (1994) Estudo dos impactos ambientais decorrentes do extrativismo mineral e poluição mercurial no Tapajós. CETEM/CNPq, Rio de Janeiro. 220.
- Castilhos ZC, Bidone ED (2000) Hg biomagnification in the ichthyofauna of the Tapajós River Region, Amazonia, Brazil. Bull Environ Contam Toxicol 64: 693-700.
- Castilhos ZC, Bidone ED, Hartz SM (2001) Bioaccumulation of mercury by tucunaré (Cichla ocellaris) from Tapajós River Region, Brazilian Amazon: A field dose-response approach. Bull Environ Contam Toxicol 66: 631-637.
- Huang SSY, Strathe AB, Fadel JG, Lin P, Liu TY, et al. (2012) Absorption, distribution, and elimination of graded oral doses of methylmercury in juvenile white sturgeon. Aquat Toxicol 122-123, 163–171.
- Castilhos ZC, Pereira LC, Almosny N, Rodrigues-Filho S, Rodrigues APC, et al. (2004b) Biochemical and hematological parameters in Amazonian fish from aquatic systems affected by gold mining. In: International conference on mercury as a global pollutant, Ljubljana, Slovenia.
- Silva LCCP (2004) Avaliação da contaminação mercurial sobre parâmetros hematológicos e bioquímicos plasmáticos de tucunarés (Cichla spp.) oriundos da região do rio Tapajós, Pará, Brasil. Dissertation, Fluminense Federal University.