Keywords
Aeromagnetic data; Heat flow; Geothermal; Spectral analysis; Bida Basin; Trend analysis
Introduction
Bida basin is one of the inland sedimentary basins in Nigeria with highly prolific hydrocarbon prospect. A lot of studies have been conducted on this sedimentary basin, but fewer geothermal potentiality research have been carried out on this part of the basin. The Aeromagnetic data of 10 sheets were combined to investigate the upper part of Bida basin to assess heat flow potentiality for geothermal production using the Curie point depth values derived from the depths of the shallow and deeper magnetic sources. Olorunsola and Aigbogun, Artemevia et al. used Curie point depths to evaluate the geothermal heat flow information of the subsurface for energy production [1,2]. In 1966, Buser established the existence of paleo structures which have direct activities like tectonic movements, metamorphism, mineralization and drainage [3]. In this regard, a great contribution was made by Ajakaiye et al. [4] while interpreting aeromagnetic data across the Nigeria continental mass, they identified that NE-SW trending anomalies are the dominant magnetic features of most of this area. Also, in 1990, Umego carried out a study of aeromagnetic field over Sokoto basin (an adjoining basin) of Northwestern Nigeria [5]. He identified the existence of large scale magnetic lineaments predominantly in the NE-SW direction. Also, in 2017, Olorunsola and Aigbogun used radiometric and magnetic data to interpret part of Anambra basin to be in NESW direction [1]. Similarly, Udensi [6], Udensi et al. [7] added a new dimension to the studies, he applied both qualitative and quantitative approaches, and established trends and the structural patterns within the Bida Basin from the aeromagnetic data. They deduced that the northern part (upper part) of the Bida basin is dominated by NE-SW trend, the central part by E-W trend, while the Southern part is dominated by ENE-WSW trends. In this study, having separated the regional data from the magnetic field data, the residual magnetic data were extensively used to estimate the Curie point depths from which geothermal gradient and heat flow values were calculated. The structural tends analysis of this basin was also carried out and compared with the adjoining and other basins if the structural trends in Nigeria are the same. Additionally, tectonically active regions affect heat flow significantly Tanaka et al. [8]. Though, Haggerty [9] cautioned against assuming 580°C as a single value for Curie point temperature, he pointed out that Curie temperature as high as 600°C if the amount of titanium is increased to the level of forming titanomagnetite and as low as 300°C may exit in the crust because of the low oxidation of titanomagnetite [10,11]. Curie point temperature of 300°C and thermal conductivity of 1.8 Wm-1°C-1 were used in this study because no volcanic eruptions have been recorded in the study area. The average heat flow in thermally normal continental regions is reported to be above 60 mWm-2. Values more than about 100 mWm-2 indicate anomalous geothermal conditions Jessop et al.
Geological setting
This research covered the Bida basin, also known as Middle Niger or Nupe basin in the northcentral part of Nigeria. The Bida basin contains sandstones that belong to the Upper Cretaceous and are underlain by the Precambrian rocks of the Basement Complex [12,13]. The regional dips of the Campanian-Maestrichitian beds and their overall vertical grain-size distribution suggest that the regional detrital grains were resulted from the Basement Complex of Southwestern Nigeria [13]. The Geological map of Nigeria showing the study area is presented in Figure 1.
Figure 1: Geological map of Nigeria (adapted from Mc Donald et al., Olasehinde).
The structural setting of bida basin
The Bida basin, which is only about 0.5-1 km deep in most of the area does not exceed 2 km in the deepest parts is a large western branch of Benue trough and it is a gently down-warped trough [14]. The epeirogenes is responsible for the genesis of the basin seems closely connected to the crustal movement of the santonian orogeny of southwestern Nigeria and the nearby Benue valley. The basin contained past orogenic molassee facies and a few thin marine strata which are unfolded. In 1976, Adeleye [13] stated that the original geometry of the basin may have been altered by Tertiary uplifts which seem to have affected the northern areas more than the southern half (Figure 2).
Figure 2: Geological setting and location of the major structural units in the study area in green and the whole of Nigeria (adapted from Kurowska, Schoeneich).
Materials and Methods
Aeromagnetic data acquisition
The aeromagnetic data of sheets 139, 140, 141, 142, 160, 161, 162, 163, 181, 182, 183 and 184 that covered the study area were acquired in 1976 on a scale of 1:1000,000. For this study, the aeromagnetic data were gotten from Nigeria Geological Survey Agency (NGSA). The sheets were taken as basic data for determining the nature of magnetic anomalies over the area published by NGSA. The contour interval is variable at 5, 10, 25 and 50nT. The survey was carried out along a series of North- South lines with a spacing of 2 km and an average flight elevation of 152.4 m above the ground level. The average magnetic inclination across the survey area was from 9° in the north to 0° in the south.
Spectral analysis method of aeromagnetic data processing
The maps were cautiously manually digitized at an equal spacing of 2.9 km yielding 361 values per sheet and 4015 values for the 12 sheets used for the whole area. While manual digitization is the simplest and least effective method of digitization, its precision when cautiously done can compare well with other digital methods [15,16]. The data from the 12 sheets were combined to form a composite map to produce a total magnetic intensity map (Figure 4), the same method was used by Udensi et al. [17]. Considering the simplicity in the trend of the magnetic field in the study area, the regional anomaly was separated from the experimental data by fitting a plane polynomial surface to the data. The study area does not have complicated geology and it has spatial extent, hence, it is acceptable and realistic to admit that the regional field is a first-degree polynomial surface. All the regional fields were therefore evaluated as a two-dimensional first-degree polynomial surface. Having separated the regional from the magnetic field; the residual data that we are interested in were Fourier transformed to derive the deeper magnetic and shallow magnetic sources. Figure 3 shows one of the thirteen plots of the spectral energies against their corresponding wavenumbers. The filtered residual data was Fourier transformed and the area was divided into 13 overlapping blocks for spectral analysis [13,18].
Figure 3: Typical plot of spectral energy against wave-number showing deeper magnetic source depths.
Figure 4: Contour of total magnetic intensity (tmi) anomaly map of the study area. the axes are in degrees and contour interval is 25 NT respectively.
The depths of the deeper and shallow magnetic sources were used to calculate the Curie point depths using the following derived equations.
Power spectrum, P, for a 2D assemblage of bodies presented below was used by Spector and Grant [19], Blakely [20]:
 (1)
(1)
Aigbogun and Olorunsola [21]; Cianciara and Marcak [22]; Nafiz [23] once used the parameters below to evaluate Cuire Point Depth. Here, kx and ky are the wavenumbers in the x and y-axes; Cm is a constant of proportionality; ÃÆÃâÃâÃÂÃÆââ¬Å¡Ã¢ââ¬Ã¢m is the power spectrum of the magnetization; Θ and Θf are the directional factors related to the magnetization; Θm and Θf geomagnetic field, respectively; and zt and zo are the shallow and deeper depths of the magnetic sources.
Afterward, the average of equation (1) can be given as
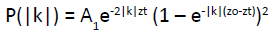 (2)
(2)
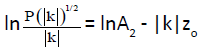
Where A1 is a constant Equation (2) can be simplified to calculate the shallow depth Zt of the magnetic source as previously used by Spector and Grant [19], Bhattacharyya and Leu [24], Okubo et al. [25]; Abraham et al. [18]; Aigbogun and Olorunsola [21] from the low-wavenumber part of the power spectrum as follows:
 (3)
(3)
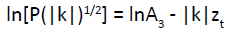
Now, ln is the natural logarithm and A2 is a constant depending on the properties of magnetization and orientation. Equation (2) is also simplified to calculate the depths of the shallow magnetic sources (zt) by assuming that the signals from the source tops dominate the spectrum. Tanaka et al. [7] established that for wavelengths less than about twice the thickness of the layer, equation (2) approximately becomes:
 (4)
(4)
The Curie point depth can be derived in two steps: the first is to calculate the (zo) of the shallow magnetic sources using equation (3) and the second is to calculate the (zt) of the deeper magnetic sources using equation (4). This method is known as centroid depth method by Bansal et al. The equation for calculating the centroid and deeper magnetic source depths for 2D structures with arbitrary polygon cross-sections was derived by Bhattacharyya and Leu [24]. Okubo et al. [25] suggested that the same equations are valid to any 3D shaped bodies. The Curie point depth is now calculated as follows:
The Curie point depths calculation was based on equation (5) obtained from the values of the deeper and shallow magnetic source depths calculated using equations (3 & 4).
 (5)
(5)
The value of the Geothermal heat flow is expressed by Fourier’s Law with equation
 (6)
(6)
Tanaka et al. [7], Tanaka and Ishikawa [26] used the same equation to calculate geothermal heat flow, where (q) is the geothermal heat flow, (λ) is the coefficient of thermal conductivity. Reiter et al. [27] carried out the thermal conductivity of all lithology and 1.8 Wm-1 °C-1 was taking as an average of Thermal conductivity value because of the predominant lithology in this area is Sandstone.
The Curie temperature (θ) can be obtained from the Curie point depth (Zb) and the thermal gradient  using the following equation;
 (7)
(7)
The geothermal heat flow values were calculated by combining equations (6) and (7)
 (8)
(8)
Interpretation of Results
The combination of the data in the twelve sheets that covered the study area produced a super map called total magnetic intensity (Figure 4). Table 1 shows the shallow and deeper magnetic source depths, Curie point depths and heat flow values derived from the power-density spectra energies of the study area.
| SPT |
Latitude (o) |
Longitude (o) |
Depth (Zo) |
Depth (Zt) |
Curie-point (Km) |
Heat Flow mWm-2 |
| SPT1 |
5.00 |
9.50 |
2.75 |
0.50 |
5.00 |
108.00 |
| SPT2 |
5.05 |
9.50 |
2.67 |
0.57 |
4.76 |
113.47 |
| SPT3 |
6.00 |
9.50 |
3.67 |
0.57 |
6.76 |
79.90 |
| SPT4 |
5.00 |
10.0 |
4.00 |
0.57 |
7.43 |
72.70 |
| SPT5 |
5.50 |
10.0 |
3.50 |
0.60 |
6.40 |
84.38 |
| SPT6 |
6.00 |
10.0 |
3.60 |
0.64 |
6.56 |
82.32 |
| SPT7 |
5.50 |
9.25 |
3.65 |
0.55 |
6.75 |
79.95 |
| SPT8 |
5.50 |
9.75 |
3.56 |
0.75 |
6.37 |
84.74 |
| SPT9 |
5.50 |
10.25 |
5.00 |
0.90 |
9.10 |
59.35 |
| SPT10 |
4.75 |
10.25 |
4.33 |
0.20 |
8.46 |
63.81 |
| SPT11 |
5.25 |
10.25 |
5.34 |
0.56 |
10.11 |
53.39 |
| SPT12 |
5.75 |
10.25 |
4.00 |
0.50 |
7.50 |
72.00 |
| SPT13 |
6.25 |
10.25 |
4.50 |
0.83 |
8.17 |
66.13 |
Table 1: Estimated depths to the basal (Zo) and shallow (Zt) magnetic sources in Km
Discussion
The aeromagnetic field study revealed the structural trend in the study area in E-W direction which is the direction of the paleo structures in the study area. The direction of the paleo structure is indicated as (A’-A) in the residual magnetic field map (Figure 5), this agreed with the work of Udensi et al. [7] which stated that two fracture zones, St. Paul’s, and Romanche are believed to pass through the Bida which is partly noticeable in this study. The lineaments A-A’ is supposed to be continental extensions of St. Paul’s fracture zone as they pass through the upper Bida basin while maintaining their E-W trend within the basin. The results from this study showed that the northern part of the study area is dominated by NE-SW trend, the Central part by NE-SW trend while the Southern part is dominated by E-W trend which agreed with the work of Udensi [6]. Several magnetic lows and high dot the study area. The closures of the magnetic low are indicated with letter L while the magnetic highs are indicated with letter H in the residual aeromagnetic map (Figure 5). These are the indications of the depth to burial and size of the intrusions within the basement complex overlain by the basin. The spectral depth explained from the spectral analysis shows the deeper magnetic source depths and it varies between 2.67 and 5.34 km within the study area (Table 1). The depths to magnetic basement increase towards the central portion of the study area. The heat flow map of the study area was produced with a contouring software called Golden Surfer and is presented above in Figure 6. In the southern part (Jebba, Mokwa and Bida), heat flows were between 113.47 and 72.70 mWm-2 while at the central area (Kainji, Akere and Zungeru), the heat flows were found between 84.38 and 79.95 mWm-2 and the heat flows at the northern part (Auna and Kotangora) is the lowest, they were found between 72.00 and 53.39 mWm-2. All the current literature states that Curie point depth and of course heat flows are greatly dependent upon geological conditions. Usually, the block that comprise high heat flow values correspond to volcanic and metamorphic regions since two blocks have high heat conductivities. Anomalous high heat flow values were observed in the southern part of the study area.
Figure 5: Residual magnetic field map of the study area. The x-y-axes are longitude and latitude coordinates in decimal degree with some magnetic closures respectively. unit of residual magnetic field = Nano tesla.
Figure 6: Heat flow map of the study area. Contour interval is 2.0 mWm-2.
Conclusion
Spectral analysis of the aeromagnetic data was used to infer the heat flow potentiality in this basin and anomalous heat flow were observed around Jebba, Mokwa and Bida. This study provides thermal information that will guide regional geothermal energy exploration within the Bida basin and Nigeria as a whole. The southern part of the study area might not be prospective for geothermal energy utilization based on the anomalous heat flow values found in the area. This area calls for more detail investigation since there is no prior volcanic or tectonic activities in this part of Nigeria. The heat flow analysis based on the geothermal gradients showed areas of higher than average values and geothermal anomalies within sedimentary basin. The heat flow assessment of the study area would be additional geophysical information for the adjoining basins.
Recommendation
The central and northern part should be subjected to more investigations because of the moderate heat flow values which is a likelihood of geothermal potentials. Therefore, more researches on heat flow should be conducted in the area with anomalous heat flow using radiometric data, and Thermal Response Test (TRT) be conducted in the area with geothermal heat flow values that fall within the range of the standard geothermal production potential.
References
- Olorunsola K, Aigbogun C (2017) Correlation and mapping of geothermal and radioactive heat production from the Anambra basin, Nigeria. Afr J Environ Sci Technol 11: 517-531.
- Artemieva IM, Mooney WD (2001) Thermal thickness and evolution of Precambrian lithosphere, a global study. J Geophys Res 106: 387-414.
- Buser, Hugo (1966) Paleo structures of Nigeria and adjacent countries. Scheizerbart’sche veragsbuchandlung, Stuttgart.
- Ajakaiye DE, Hall DH, Ashiekaa JA, Udensi EE (1991) Magnetic anomalies in the Nigerian continental mass based on aeromagnetic surveys. Tectonophysics 192: 211-230.
- Umego MN (1990) Structural interpretation of gravity and aeromagnetic anomalies over the Sokoto basin, northwestern Nigeria. Ahmadu bello university, Zaria, Nigeria.
- Udensi EE (2001) Interpretation of the total magnetic field over the Nupe basin in west central Nigeria using aeromagnetic data Nigeria. Ahmadu Bello University, Zaria, Nigeria.
- Udensi EE, Osazuwa IB, Daniyan MA (2003) Trend analysis of the total magnetic field over the bida basin, Nigeria Fed Univ Tech, Minna and Ahmadu Bello Univ, Zaria.
- Tanaka A, Okubo Y, Matsubayashi O (1999) Curie point depth base on spectrum analysis of the magnetic anomaly data in east and southeast Asia. Tectonophysics 306: 461-470.
- Haggerty S (1978) Mineralogical constraints on curie isotherm in deep crustal magnetic bodies. Geophys Res Lett 5: 105-108.
- Stacey F, Banerjee S (1974) The physical principles of rock magnetism. Elsevier, Amsterdam, p: 195.
- Frost B, P Shive (1986) Magnetic mineralogy of the lower continental crust. J Geophys Res 48: 376-390.
- Russ W (1957) The geology of Niger Zaria and Sokoto provinces. Geol Surv Nigeria Bull 27: 1-42.
- Adeleye DR (1976) The geology of middle Niger basin. Geol Nigeria Elizab, Lagos, p: 283-287.
- Ojo SB, Ajakaiye DE (1989) Preliminary interpretation of gravity measurements in the middle Niger basin area, Nigeria. In: Geology of Nigeria (Kogbe CA 2nd Revised Edn). Abiprint & Pak Ltd., Ibadan.
- Udensi EE, Osazuwa IB (2004) Spectral determination of depths to magnetic rocks under the Nupe Basin, Nigeria. NAPE 17: 22-27.
- Bath M (1974) Spectral analysis in geophysics, Elsevier, Amsterdam, pp: 580.
- Udensi EE, Osazuwa, Daniyan MA (2000) Production of a composite aeromagnetic map of the Nupe basin, Nigeria.
- Abraham EM, Obande EG, Chukwu M, Chukwu CG, Onwe MR (2015) Estimating depth to the bottom of magnetic sources at WIKKI warm spring region, northeastern Nigeria, using fractal distribution of sources approac. Turkish J of Earth Sci 24.
- Spector A, Grant FS (1970) Statistical models for interpreting aeromagnetic data. Geophysics 35: 293-302.
- Blakely RJ (1995) Potential theory in gravity and magnetic applications. 1st Edn Cambridge, Cambridge University Press.
- Aigbogun C, Olorunsola K (2018) Determination of curie point depth Anambra basin and its environs using high resolution airborne magnetic data.
- Cianciara B, Marcak H (1976) Interpretation of gravity anomalies by means of local power spectra. Geophys Prospect 24: 273-286.
- Nafiz Maden (2009) Crustal thermal properties of the pontides (northern turkey) deduced from spectral analysis of magnetic data. Turkish J Earth Sci 18: 383-392.
- Bhattacharryya BK, Leu LK (1975) Analysis of magnetic anomalies over Yellowstone National park mapping the curie-point isotherm surface for geothermal reconnaissance. J Geophy Res 80: 4461-4465
- Okubo Y, Graft RJ, Hansen RO, Ogawa K, Tsu H (1985) Curie point depths of the island of Kyushu and surrounding areas, Japan. Geophys 53: 481-494.
- Tanaka A, Ishikawa Y (2005) Crustal thermal regime inferred from magnetic anomaly data and its relationship to seismogenic layer thickness: the Japanese islands case study. Phys Earth Planet Inter 152: 257-266.
- Reiter MA, Jessop AM (1985) Estimates of terrestrial heat flow in offshore eastern Canada. Can J Earth Sci 22: 1503–1517.