Keywords
Ni and Fe; Vegetables; Target hazard quotient; Biomonitor
Introduction
Nickel (Ni) and iron (Fe) are essential for healthy plant life [1,2]. As a result, it is found naturally in most vegetables. Studies on Ni and Fe levels in the vegetables can are reported in the literature such as a study on Fe levels in the vegetables from East Africa and Ni levels in greenhouse vegetables [3,4].
Contaminated vegetables considered as one of the most important aspects of food quality assurance [5]. Since every year, millions of humans over the world are exposed to the contaminated vegetables by heavy metals [6]. Consequently, many researchers investigated the heavy metal levels in the daily consumable vegetables for its importance and significance from public health point of view.
The transfer of heavy metals from the vegetables to the human body can cause various diseases. This public concern can be justified based on the numerous papers published from developing countries such as Bangladesh, China, India, South Africa and Nigeria [2,7-10]. This indicated that the human health risks of metals in the vegetables have been widely reported in the literature [6,11,12]. It is important to investigate the soil pollution since the soil is the environmental matrix for the healthy growth of the vegetables. It is, therefore, studies on the relationships of metal levels between vegetables and their habitat soils are usually focused upon based on many reported studies such as from Chongqing, Southwest of China, Bangladesh and greenhouse vegetable cultivation from Kunming City (China) [13-15].
The objectives of this study are to: 1) assess the concentrations of Ni and Fe in vegetables at three farming areas in Peninsular Malaysia, 2) assess the human health risks of Ni and Fe in the fruit types and leafy types of vegetables and 3) to assess the potential of vegetables as good of Ni and Fe by studying the relationships of both metals between the vegetables and geochemical fractions of the habitat top soils.
Materials and Methods
Study area and sampling
Eighteen species of vegetables were collected from Kg Ara Kuda (Ara), Kuala Ketil (Ketil) and Kg Sitiawan Manjung (Manjung) of Peninsular Malaysia. Manjung is an agricultural and residential area. Ara is also an agricultural area and is surrounded by palm oil plantation. Ketil is located in the vicinity of residential area and roadside. The main method of irrigation of the three vegetable farming sites is domestic wastewater from the nearby streams and tube well. All sampling of vegetables and their habitat topsoils were conducted between September 2016 and January 2017 (Figure 1).
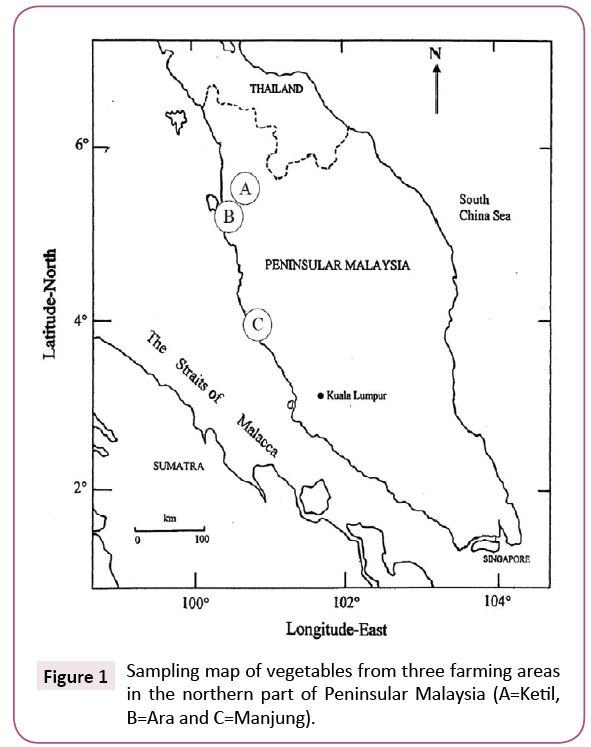
Figure 1: Sampling map of vegetables from three farming areas in the northern part of Peninsular Malaysia (A=Ketil, B=Ara and C=Manjung).
About 3-15 individuals (depend on their size) of each vegetable species were randomly collected from each sampling site. Habitat topsoils (0-10 cm) were also collected from where the vegetables grew. The vegetables were harvested by hand carefully while the topsoils were collected by using a soil auger. All the collected samples were then stored in clean polythene bags.
In this study, the 18 vegetables with 12 fruit types and 8 leafy types were investigated. The morphology and classification of the vegetables from selected vegetables were identified according to Chin and Yap and Prohens and Nuez (Table 1) [16-18].
| No. |
Site |
Sampling date |
Vegetable |
Edible parts |
Site description/ Source of irrigation |
| 1 |
Manjung |
26-Oct-16 |
Allium tuborosum |
Leave |
Agriculture and residential area/Domestic waste water |
| 2 |
Ara |
29-Sep-16 |
Amaranthus tricolor |
Leave |
Agriculture area surrounded by palm oil plantation/Tube well and stream |
| 3 |
Ara |
29-Sep-16 |
Amaranthus viridis |
Leave |
Road side of main road Penanti to Tasek Gelugor/Tube well and stream |
| 4 |
Manjung |
26-Oct-16 |
Brassica rapa |
Leave |
Road side and residential area/ Domestic waste water |
| 5 |
Manjung |
9-Nov-16 |
Ipomoea reptans |
Leave |
Road side, less than 1 km from coastal region/ Tube well and stream |
| 6 |
Manjung |
9-Nov-16 |
Lactuca sativa |
Leave |
Agriculture and residential area/ Domestic waste water |
| 7 |
Ara |
12-Oct-16 |
Abelmoschus esculentus |
Fruit |
Palm oil plantation, main road/ Tube well and stream |
| 8 |
Ara |
20-Oct-16 |
Benincasa hispida |
Fruit |
Main road Penanti to Tasek Gelugor/Tube well and stream |
| 9 |
Ara |
20-Oct-16 |
Capsicum annum |
Fruit |
Road side and surrounded by palm oil plantation/Tube well and stream |
| 10 |
Ara |
12-Oct-16 |
Cucumis sativus |
Fruit |
Main road Penanti to Tasek Gelugor/Tube well and stream |
| 11 |
Ketil |
11-Jan-17 |
Cucurbita moschata |
Fruit |
Residential area/Nearest stream |
| 12 |
Ketil |
21-Dec-16 |
Lagenaria siceraria |
Fruit |
Residential area/Nearest stream |
| 13 |
Ketil |
21-Dec-16 |
Luffa acutangula |
Fruit |
Road side of main road Baling to Petani River/Nearest stream |
| 14 |
Ara |
12-Oct-16 |
Momordica charantia |
Fruit |
Agriculture area surrounded by palm oil plantation/Tube well and stream |
| 15 |
Ketil |
8-Dec-16 |
Momordica charantia L. |
Fruit |
Private farm about 6 acres near residential area/Tube well and stream |
| 16 |
Manjung |
17-Nov-16 |
Solanum melongena |
Fruit |
Fisherman village/Domestic waste water and stream |
| 17 |
Ketil |
8-Dec-16 |
Tricosanthes celebica |
Fruit |
Residential area/Nearest stream |
| 18 |
Ketil |
8-Dec-16 |
Vigna sinesis |
Fruit |
Road side, in between Baling to Petani River/Nearest stream |
Table 1: Description for sampling site of 18 vegetables collected from Kg Ara Kuda (Ara), Kuala Ketil (Ketil) and Kg Sitiawan Manjung (Manjung) of Peninsular Malaysia.
Preparation of vegetables and top soil samples
The vegetable samples were sorted in accordance with to their types of species. All samples were brought to the laboratory for analyses. The collected samples were washed with distilled water to remove soil particles. Then, the samples were cut into small pieces using a clean knife. They were dried in an oven at 60°C for 72 h until constant dry weights. After drying, the vegetable samples were grinded into a fine powder using a commercial blender and stored in polyethylene bags, before used for acid digestion.
For the topsoil samples, the collected samples were dried in an oven at 100°C for 72 h until constant dry weights. Later, the dried soils were grinded into a fine powder using a mortar and pestle and they were sieved under 63 μm mesh size sieve. For the geochemical fractionations, triplicates of the topsoils were fractionated into three fractions namely, first fraction as ‘easily, freely, leachable and exchangeable’ (F1), second fraction as ‘acid-reducible’ (F2) and third fraction as ‘oxidisable-organic’ (F3). The summation of F1, F2 and F3 will form the non-resistant (NR) fraction. The geochemical fraction analysis on the topsoils was based on Badri and Aston [19].
Determination of Ni and Fe
All samples stored in acid-washed pill boxes were analyzed by using an atomic absorption spectrophotometer (AAS) model Thermo Scientific iCE 3000 series for Ni and Fe at the Faculty of Science of Universiti Putra Malaysia. Auto zero by using blank was conducted for calibration of the instrument. Standard solutions of Ni and Fe were prepared from 1000 ppm stock solution of each metal provided by Sigma-Aldrich for both metals and the data obtained from the AAS were presented in mg/kg dry weight basis.
For quality assurance and quality control, all the glass wares used in this study were acid-washed to avoid external contamination. Two certified reference materials (CRM) were used to check for the analytical procedures and accuracy of the method used. The CRM for Ni and Fe included were NSC DC 73319 for soil and NIST 1547 for Peach Leaf. Based on the soil CRM, the recovery for Ni was 131% but it was not available for Fe. The Peach Leaf CRM for Fe and Ni were 97 and 117.2%, respectively (Table 2).
| |
NSC DC 73319 (Soil) |
Standard Reference Materials for Peach Leaves NIST 1547 |
| Certified value |
Measured value |
Recovery (%) |
Certified value |
Measured value |
Recovery (%) |
| Fe |
NA |
14585 |
- |
219.8 |
211 |
97.0 |
| Ni |
20.4 ± 1.8 |
26.68 ± 0.4 |
130.76 |
0.689 |
0.81 |
117 |
*NA: CRM values is not available
Table 2: Comparisons of metal concentrations (mg/kg dry weight) between certified and measured values.
The certified values were based on Certified Reference Materials for Soils (NSC DC 73319) and Standard Reference Materials for Peach Leaves (NIST 1547)
Determination of water content and conversion factor
Water content in the samples was calculated to determine the amount of moisture trapped in the samples until get the constant weight. The percentage of water content (WC) was calculated as below:
WC=(wet weight (g) ‒ dry weight (g)) × 100%/wet weight (g)
The means values of conversion factor (CF) of the edible parts of all vegetables are presented in Table 3.
| No. |
Vegetables |
CF |
| 1. |
Abelmoschus esculentus |
0.095 |
| 2. |
Allium tuborosum |
0.084 |
| 3. |
Amaranthus tricolor |
0.101 |
| 4. |
Amaranthus viridis |
0.080 |
| 5. |
Benincasa hispida |
0.052 |
| 6. |
Brassica rapa |
0.099 |
| 7. |
Capsicum annum |
0.091 |
| 8. |
Cucumis sativus |
0.043 |
| 9. |
Cucurbita moschata |
0.160 |
| 10. |
Ipomoea reptans |
0.100 |
| 11. |
Lactuca sativa |
0.068 |
| 12. |
Lagenaria siceria |
0.056 |
| 13. |
Luffa acutangular |
0.054 |
| 14. |
Momordica charantia |
0.061 |
| 15. |
Momordica charantia L |
0.046 |
| 16. |
Solanum melongena |
0.080 |
| 17. |
Tricosanthes celebica |
0.052 |
| 18. |
Vigna sinensis |
0.094 |
Table 3: Conversion factor (CF) of the edible parts of 18 vegetables from three farming sites in Peninsular Malaysia.
Data treatment
For the human health risk assessment, the present metal concentrations in dry weight (dw) basis were converted into wet weight basis because consumption (or cooking) of the vegetables is assumed to be in wet weight (ww). Therefore, the present concentrations (mg/kg dry weight) of Fe and Ni were converted to wet weight basis by using respective conversion factor for each vegetable, as shown in Table 3.
The estimated daily intake (EDI) value was calculated using the following formula:
EDI=(Mc × CR)/BW
Where, Mc=The metal concentration in vegetables (mg/kg wet weight); CR=The consumption rate of vegetables (345 g/day for adults and 232 g/day for children) and average body weight (55.90 kg for adults and 32.70 kg for children), respectively [5]. The present study is a preliminary study from Malaysia. The consumption rate of vegetables for Malaysian is not clearly available in the literature. So, we applied that from an Asian country like China for the present study [5].
In this study, a non-cancer risk assessment method is based on the use of target hazard quotient (THQ), a ratio between the estimated dose of contaminant and the reference dose. The THQ value below 1.0 indicates there will not be any non-carcinogenic risk of metal investigated. The THQ determined with the formula described by USEPA [20]:
THQ=EDI/RfD
Where, EDI=Estimated daily intake calculated previosuly; RfD=The oral reference dose.
The RfD values (μg/kg/day) used in this study were: Ni: 20.0 and Fe: 700, provided by the USEPA's regional screening level [21].
The transfer factor (TF) can be used to evaluate the potential capability of crops to transfer metals from soil to edible parts. It is defined as the ratio of the metal concentration in the edible part of crop to metal concentration in the habitat soils [14,22]. This factor represents the potential capability of heavy metals’ transmission from soil to the edible parts of vegetable [23,24]. The TF was calculated based on dry weight, as follows:
TF=Cvegetable/Csoil
Where, Cvegetable=The metal concentration (mg/kg dry weight) in the vegetable; Csoil=The metal concentration (mg/kg dry weight) in the geochemical fractions namely F1, F2, F3 and NR in the habitat top soils.
Statistical analysis
Statistical analysis for metal concentration in different edible parts of vegetables and soil were calculated by using SPSS Statistics 22. Correlation analysis of metals between the vegetables and their habitat top soils using Spearman’s rank was applied, because of N<30. The graphical relationships of metals between the leafy types and fruit types of vegetables were done by using Kaleidagraph version 3.08. The rationale of using F1, F2 and F3 for the correlation of metals with vegetables was due to the fact these three geochemical fractions are mostly related to anthropogenic sources [19]. Therefore, it is more relevant from eco-toxicological point of view to correlate with the metal levels in the vegetables rather than to correlate with the total concentrations of metals in the top soils [25]. Comparison between two samples was conducted by using t-test in SPSS Statistics 22.
Results and Discussion
Concentrations of Ni and Fe
The Ni concentrations (mg/kg dw) in the fruit vegetables range from 0.18 to 2.32 (mean: 1.31) while 1.22 to 4.85 (mean: 2.44) for the leafy vegetables. The Fe concentrations (mg/kg dw) in the fruit vegetables range from 89.8 to 155 (mean: 117) while 175 to 306 (mean: 213) for the leafy vegetables. The levels of Ni and Fe are all significantly (P<0.05) higher in the leafy vegetables than those in the fruit vegetables (Tables 4-7).
| Fruit vegetables |
Ni |
NiF1 |
NiF2 |
NiF3 |
NiNR |
Ni/F1 |
Ni/F2 |
Ni/F3 |
Ni/NR |
| Momordica charantia |
2.17 |
0.15 |
1.62 |
2.54 |
4.31 |
14.5 |
1.34 |
0.85 |
0.50 |
| Abelmoschus esculentus |
1.45 |
0.14 |
1.52 |
2.40 |
4.06 |
10.4 |
0.95 |
0.60 |
0.36 |
| Cucumis sativus |
1.40 |
0.13 |
1.55 |
2.26 |
3.94 |
10.8 |
0.90 |
0.62 |
0.36 |
| Benincasa hispida |
1.98 |
0.15 |
1.29 |
2.14 |
3.58 |
13.2 |
1.53 |
0.93 |
0.55 |
| Capsicum annum |
1.02 |
0.12 |
0.99 |
1.40 |
2.47 |
8.50 |
1.03 |
0.73 |
0.41 |
| Solanum melongena |
2.32 |
0.17 |
1.44 |
2.47 |
4.08 |
13.7 |
1.61 |
0.94 |
0.57 |
| Momordica charantia L. |
0.18 |
0.08 |
0.19 |
0.37 |
0.57 |
2.25 |
0.95 |
0.49 |
0.32 |
| Vigna sinesis |
0.92 |
0.09 |
0.47 |
0.94 |
1.42 |
10.2 |
1.96 |
0.98 |
0.65 |
| Lagenaria siceraria |
1.12 |
0.06 |
0.46 |
1.07 |
1.59 |
18.7 |
2.43 |
1.05 |
0.70 |
| Luffa acutangula |
0.68 |
0.12 |
0.26 |
0.72 |
0.99 |
5.67 |
2.62 |
0.94 |
0.69 |
| Tricosanthes celebica |
1.62 |
0.09 |
0.71 |
1.74 |
2.54 |
18.0 |
2.28 |
0.93 |
0.64 |
| Cucurbita moschata |
0.87 |
0.02 |
0.32 |
0.38 |
0.72 |
43.5 |
2.72 |
2.29 |
1.21 |
| Minimum |
0.18 |
0.02 |
0.19 |
0.37 |
0.57 |
2.25 |
0.90 |
0.49 |
0.32 |
| Maximum |
2.32 |
0.17 |
1.62 |
2.54 |
4.31 |
43.5 |
2.72 |
2.29 |
1.21 |
| Mean (12) |
1.31 |
0.11 |
0.90 |
1.54 |
2.52 |
14.1 |
1.69 |
0.95 |
0.58 |
| Standard deviation |
0.64 |
0.04 |
0.56 |
0.83 |
1.43 |
10.4 |
0.69 |
0.46 |
0.24 |
| Standard error |
0.18 |
0.01 |
0.16 |
0.24 |
0.41 |
3.00 |
0.20 |
0.13 |
0.07 |
*F1=‘Easily, freely, leachable or exchangeable’ fraction; F2=‘Acid-reducible’ fraction; F3=‘Oxidisable-organic’ fraction
NR: Non-Resistant Fraction (summation of F1, F2 and F3 fractions)
Table 4: The concentration (mean ± SD, mg/kg dry weight) of Ni in the fruit vegetables, geochemical fractions of the habitat top soils and their transfer factors (Ni/F1, Ni/F3, Ni/F3 and Ni/NR) collected from three farming sites in Peninsular Malaysia.
| Leafy vegetables |
Ni |
NiF1 |
NiF2 |
NiF3 |
NiNR |
Ni/F1 |
Ni/F2 |
Ni/F3 |
Ni/NR |
| Amaranthus viridis |
3.93 |
0.19 |
1.84 |
3.98 |
6.01 |
20.7 |
2.14 |
0.99 |
0.65 |
| Amaranthus tricolor |
4.85 |
0.19 |
2.69 |
5.17 |
8.05 |
25.5 |
1.80 |
0.94 |
0.60 |
| Lactuca sativa |
1.22 |
0.15 |
1.43 |
2.21 |
3.79 |
8.13 |
0.85 |
0.55 |
0.32 |
| Ipomoea reptans |
1.71 |
0.13 |
1.88 |
1.64 |
3.65 |
13.2 |
0.91 |
1.04 |
0.47 |
| Brassica rapa |
1.41 |
0.05 |
0.96 |
0.78 |
1.79 |
28.2 |
1.47 |
1.81 |
0.79 |
| Allium tuborosum |
1.50 |
0.09 |
0.75 |
1.60 |
2.44 |
16.7 |
2.00 |
0.94 |
0.61 |
| Minimum |
1.22 |
0.05 |
0.75 |
0.78 |
1.79 |
8.13 |
0.85 |
0.55 |
0.32 |
| Maximum |
4.85 |
0.19 |
2.69 |
5.17 |
8.05 |
28.2 |
2.14 |
1.81 |
0.79 |
| Mean (6) |
2.44 |
0.13 |
1.59 |
2.56 |
4.29 |
18.7 |
1.53 |
1.05 |
0.57 |
| Standard deviation |
1.55 |
0.06 |
0.70 |
1.67 |
2.34 |
7.58 |
0.55 |
0.41 |
0.16 |
| Standard error |
0.63 |
0.02 |
0.29 |
0.68 |
0.96 |
3.10 |
0.22 |
0.17 |
0.07 |
*F1=‘easily, freely, leachable or exchangeable’ fraction; F2=‘acid-reducible’ fraction; F3=‘oxidisable-organic’ fraction
NR: Non-Resistant Fraction (summation of F1, F2 and F3 fractions)
Table 5: The concentration (mean ± SD, mg/kg dry weight) of Ni in the leafy vegetables, geochemical fractions of the habitat top soils and their transfer factors (Ni/F1, Ni/F3, Ni/F3 and Ni/NR) collected from three farming sites in Peninsular Malaysia.
| Fruit vegetables |
Fe |
FeF1 |
FeF2 |
FeF3 |
FeNR |
Fe/F1 |
Fe/F2 |
Fe/F3 |
Fe/NR |
| Momordica charantia |
127 |
4.55 |
200 |
1444 |
1649 |
27.9 |
0.63 |
0.09 |
0.08 |
| Abelmoschus esculentus |
123 |
3.86 |
183 |
1388 |
1576 |
31.8 |
0.67 |
0.09 |
0.08 |
| Cucumis sativus |
109 |
3.60 |
159 |
1310 |
1473 |
30.3 |
0.69 |
0.08 |
0.07 |
| Benincasa hispida |
115 |
5.14 |
166 |
2354 |
2525 |
22.3 |
0.69 |
0.05 |
0.05 |
| Capsicum annum |
110 |
1.29 |
25.2 |
651 |
678 |
85.6 |
4.37 |
0.17 |
0.16 |
| Solanum melongena |
120 |
3.65 |
183 |
1382 |
1569 |
32.8 |
0.65 |
0.09 |
0.08 |
| Momordica charantia L. |
112 |
2.16 |
162 |
1321 |
1485 |
51.7 |
0.69 |
0.08 |
0.08 |
| Vigna sinesis |
155 |
1.06 |
275 |
1597 |
1873 |
146 |
0.56 |
0.10 |
0.08 |
| Lagenaria siceraria |
105 |
2.41 |
131 |
1299 |
1432 |
43.6 |
0.80 |
0.08 |
0.07 |
| Luffa acutangula |
125 |
3.98 |
202 |
2392 |
2598 |
31.5 |
0.62 |
0.05 |
0.05 |
| Tricosanthes celebica |
108 |
4.91 |
1489 |
1311 |
1465 |
22.0 |
0.73 |
0.08 |
0.07 |
| Cucurbita moschata |
89.8 |
0.62 |
86.6 |
2182 |
2269 |
145 |
1.04 |
0.04 |
0.04 |
| Minimum |
89.8 |
0.62 |
25.2 |
651 |
678 |
22.0 |
0.56 |
0.04 |
0.04 |
| Maximum |
155 |
5.14 |
275 |
2392 |
2598 |
146 |
4.37 |
0.17 |
0.16 |
| Mean (12) |
117 |
3.10 |
160 |
1553 |
1716 |
55.9 |
1.01 |
0.08 |
0.08 |
| Standard deviation |
15.8 |
1.55 |
62.0 |
510 |
534 |
45.3 |
1.06 |
0.03 |
0.03 |
| Standard error |
4.56 |
0.45 |
17.9 |
147 |
154 |
13.1 |
0.31 |
0.01 |
0.01 |
*F1=‘easily, freely, leachable or exchangeable’ fraction; F2=‘acid-reducible’ fraction; F3=‘oxidisable-organic’ fraction
NR: Non-Resistant Fraction (summation of F1, F2 and F3 fractions)
Table 6: The concentration (mean ± SD, mg/kg dry weight) of Fe in the fruit vegetables, geochemical fractions of the habitat top soils and their transfer factors (Fe/F1, Fe/F3, Fe/F3 and Fe/NR) collected from three farming sites in Peninsular Malaysia.
| Leafy vegetables |
Fe |
FeF1 |
FeF2 |
FeF3 |
FeNR |
Fe/F1 |
Fe/F2 |
Fe/F3 |
Fe/NR |
| Amaranthus viridis |
179 |
4.57 |
391 |
5827 |
6223 |
39.1 |
0.46 |
0.03 |
0.03 |
| Amaranthus tricolor |
199 |
5.45 |
344 |
4945 |
5294 |
36.5 |
0.58 |
0.04 |
0.04 |
| Lactuca sativa |
306 |
1.22 |
920 |
3250 |
4171 |
251 |
0.33 |
0.09 |
0.07 |
| Ipomoea reptans |
232 |
5.53 |
344 |
2652 |
3002 |
41.9 |
0.67 |
0.09 |
0.08 |
| Brassica rapa |
187 |
4.95 |
372 |
3795 |
4172 |
37.8 |
0.50 |
0.05 |
0.04 |
| Allium tuborosum |
175 |
0.32 |
346 |
2907 |
3254 |
548 |
0.51 |
0.06 |
0.05 |
| Minimum |
175 |
0.32 |
344 |
2652 |
3002 |
36.5 |
0.33 |
0.03 |
0.03 |
| Maximum |
306 |
5.53 |
920 |
5827 |
6223 |
548 |
0.67 |
0.09 |
0.08 |
| Mean (6) |
213 |
3.67 |
453 |
3896 |
4353 |
159 |
0.51 |
0.06 |
0.05 |
| Standard deviation |
49.9 |
2.29 |
229 |
1247 |
1223 |
208 |
0.11 |
0.03 |
0.02 |
| Standard error |
20.4 |
0.94 |
93.7 |
509 |
499 |
85.1 |
0.05 |
0.01 |
0.01 |
F1=‘easily, freely, leachable or exchangeable’ fraction; F2=‘acid-reducible’ fraction; F3=‘oxidisable-organic’ fraction
NR: Non-Resistant Fraction (summation of F1, F2 and F3 fractions)
Table 7: The concentration (mean ± SD, mg/kg dry weight) of Fe in the leafy vegetables, geochemical fractions of the habitat top soils and their transfer factors (Fe/F1, Fe/F3, Fe/F3 and Fe/NR) collected from three farming sites in Peninsular Malaysia.
Based on the cited data from Li et al. [22], the Ni concentrations (mg/kg ww) in the fruit vegetables range from 0.054 to 0.536 (mean: 0.184). For the leafy vegetables, the levels of Ni range from 0.110 to 0.322 (mean: 0.195). Therefore, Li et al. [22] findings supported the present results on the higher levels of Ni in the leafy vegetables than those in the fruit vegetables. The higher levels of heavy metals in the leafy vegetables agreed with previous findings in the literature [4,24,26]. This indicated that leafy vegetables have higher transportation rates than other vegetable types [27]. This might be due to the more barriers preventing heavy metals’ transmission from soil to fruits than those to leaves [28] (Tables 8 and 9).
| Fruit vegetables |
Scientific name |
Ni |
| Eggplant |
Solanum melongena |
0.137 |
| Tomato |
Lycopersicon esculentum |
0.054 |
| Cucumber |
Cucumis sativus L. |
0.074 |
| Suakwa towel gourd |
Luffa cylindrical (Linn.) Roem. |
0.077 |
| Bitter gourd |
Momordica charantia |
0.224 |
| Green cowpea |
Vigna unguiculata (Linn.) |
0.536 |
| |
Minimum |
0.054 |
| |
Maximum |
0.536 |
| |
Mean |
0.184 |
| |
Standard deviation |
0.183 |
| |
Standard error |
0.075 |
Table 8: The mean concentrations (mg/kg wet weight) of fruit vegetables in the vegetables grown on reclaimed tidal flat soils in the Pearl River Estuary (China). Data cited from Li et al. [22].
| Leafy vegetables |
Scientific name |
Ni |
| Cabbage |
Brasssica oleracea L. var capitata L. |
0.201 |
| Chinese lactuca |
Lactuca sativa L. var. asparagina |
0.322 |
| Pakchoi |
Brassica chinensis |
0.110 |
| Chinese flowering cabbage |
Brassica rapa chinensis |
0.256 |
| Romaine lettuce |
Lactuca sativa L. var. longifolia |
0.197 |
| Edible amaranth |
Amaranthus mangostanus L. |
0.167 |
| Water spinach |
Ipomaea aquatica Forssk |
0.112 |
| Leaf mustard |
Brassica juncea Coss |
0.196 |
| |
Minimum |
0.110 |
| |
Maximum |
0.322 |
| |
Mean |
0.195 |
| |
Standard deviation |
0.070 |
| |
Standard error |
0.025 |
Table 9: The mean concentrations (mg/kg ww) of leafy vegetables grown on reclaimed tidal flat soils in the Pearl River Estuary (China). Data cited from Li et al. [22].
Based on Tables 4 and 5, the Ni concentrations (mg/kg dw) in the F1, F2, F3 and NR of the habitat top soils range from 0.02-0.19, 0.19-2.69, 0.37-5.17 and 0.57-8.05, respectively. Based on Tables 6 and 7, the Fe concentrations (mg/kg dw) in the F1, F2, F3 and NR of the habitat top soils range from 0.32-5.53, 25.2-920, 651- 5827 and 678-6223, respectively.
Transfer factor
Between the fruit types and leafy types of vegetables, the levels of Ni and Fe are significantly (P<0.05) higher in the leafy vegetables than those in the fruit vegetables. The TF values of leafy vegetables in Ni and Fe were higher than those in the fruit vegetables, based on F1 of the habitat top soils. However, this pattern is not well indicated based on F2, F3 and NR geochemical fractions (Tables 4-7).
Based on the Ni TF for the fruit vegetables, they range from 2.25- 43.5 for Ni/F1, 0.90-2.72 for Ni/F2, 0.49-2.29 for Ni/F3 and 0.32- 1.21 for Ni/NR. Based on the Ni TF for the leafy vegetables, they range from 8.13-28.2 for Ni/F1, 0.85-2.14 for Ni/F2, 0.55-1.81 for Ni/F3 and 0.32-0.79 for Ni/NR (Tables 4 and 5).
Based on the Fe TF for the fruit vegetables, they range from 22.0- 146 for Fe/F1, 0.56-4.37 for Fe/F2, 0.04-0.17 for Fe/F3 and 0.04- 0.16 for Fe/NR. Based on the Fe TF for the leafy vegetables, they range from 36.5-548 for Fe/F1, 0.33-0.67 for Fe/F2, 0.03-0.09 for Fe/F3 and 0.03-0.08 for Fe/NR. The present study indicated that TF values varied greatly with the vegetable species and this agreed with those reported by Cui et al. [29] and Qureshi et al. [30] (Tables 6 and 7).
From Tables 4 to 7, the mean values of TF for Ni/F1 and Fe/F1 in leafy vegetables are higher than those in the fruit vegetables. This implies that Cd and Pb can be easily accumulated in the leafy vegetables from the F1 fraction of the top soils. The higher Fe TF values than those for Ni were consistent with the findings of Qureshi et al. [30] and Liu et al. [31]. These results also demonstrate that Fe is easily transferable to leafy vegetables, while transfer of Ni from soils into the edible parts of vegetables faced much more resistance [6]. It is generally argued that Fe has more capacity to make strong binding with enzymes as compared to Ni when both metals simultaneously enter into the plant cells because Ni and Fe affect nucleic acid metabolism in the same manner [32]. Consequently, Fe is easier than Ni to transfer from soil to the edible part of crops. In fruit vegetables, TF values were lower in tomatoes and radish which might be due to the observed differences in soil properties. The variations in TF of metals in different vegetables are also related to each vegetable's absorption capability, soil nutrient management and soil properties [33]. Therefore, by consuming selective vegetables with low levels of Ni and Fe accumulation and TF values, the risk of human exposure to the contamination of both metals can be significantly reduced.
Relationships of metals between vegetables and geochemical fractions of the top soils
The relationships of Ni between the vegetables and their habitat top soils (four geochemical fractions: F1, F2, F3 and NR), are presented in Figure 2. It is found that the Ni levels in the vegetables are highly correlated with the F1 (R=0.70), F2 (R=0.83), F3 (R=0.94) and NR (R=0.92) fractions of the habitat top soils. This indicated that Ni geochemical fractions (F1, F2, F3 and NR) in the habitat top soils are considered readily and potentially bioavailable to the vegetables [31]. Therefore, continuous root uptake of Ni from the habitat top soils to the vegetables can be expected because of their significant (P<0.05) correlations of Ni between the vegetables and habitat top soils (Figure 2).
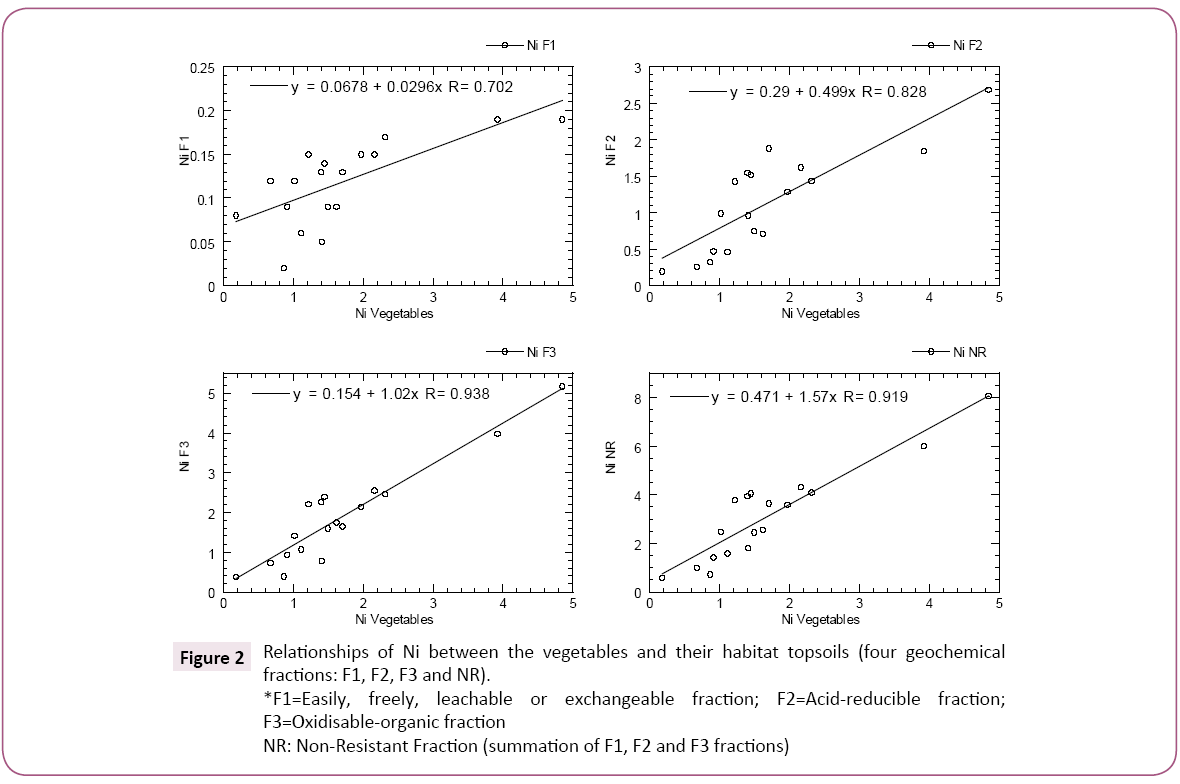
Figure 2: Relationships of Ni between the vegetables and their habitat topsoils (four geochemical
fractions: F1, F2, F3 and NR).
*F1=Easily, freely, leachable or exchangeable fraction; F2=Acid-reducible fraction;
F3=Oxidisable-organic fraction
NR: Non-Resistant Fraction (summation of F1, F2 and F3 fractions)
Fan et al. [4] studied the correlation of heavy metal levels between the greenhouse vegetables and soil general properties (including the geochemical fractions). They found that the concentrations of Ni in greenhouse leafy vegetables were highly (R=0.85) correlated with concentrations of Ni bound to the geochemical fraction of organic matter and sulfides in greenhouse soil. This showed that Ni in vegetables could be predicted by Ni concentrations in the organic matter and sulfides of the soils. Therefore, present study indicated that Ni bioaccumulation in the vegetables can be indicated by the Ni levels in the geochemical fractions of EFLE, ‘acid-reducible’, ‘oxidisable-organic’ and non-resistant of the habitat top soils.
The relationships of Fe between the vegetables and their habitat top soils (four geochemical fractions: F1, F2, F3 and NR), are presented in Figure 3. It is found that the Fe levels in the vegetables are highly correlated particularly with the F2 only (R=0.94), followed by NR (R=0.67) and F3 (0.60). Obviously, there is no relationship of Fe between the vegetables and F1. Liu et al. [34] also found that the metal concentrations in vegetables and corresponding soils were poorly correlated (Figure 3).
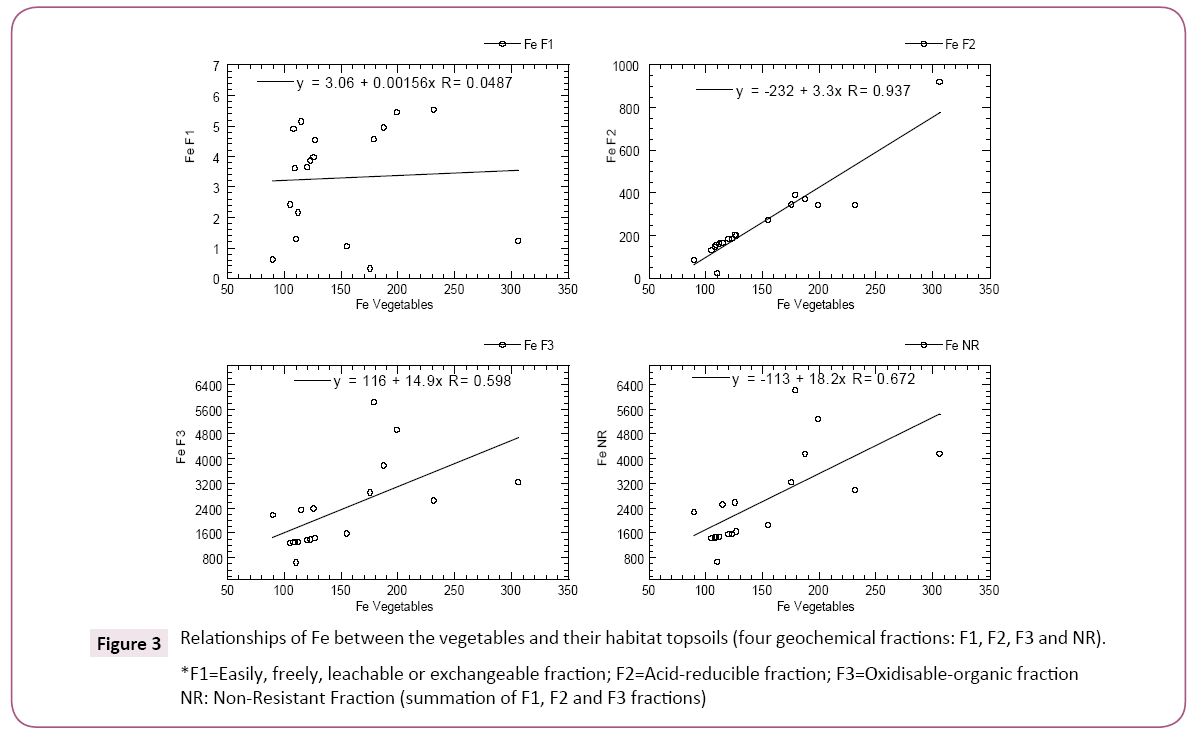
Figure 3: Relationships of Fe between the vegetables and their habitat topsoils (four geochemical fractions: F1, F2, F3 and NR).
*F1=Easily, freely, leachable or exchangeable fraction; F2=Acid-reducible fraction; F3=Oxidisable-organic fraction NR: Non-Resistant Fraction (summation of F1, F2 and F3 fractions)
Besides the root uptake of Ni and Fe to the leaves of vegetables, atmospheric deposition could influence the bioavailability and contamination of both metals in local vegetables [14]. The difference of soil bioavailability between the Ni and Fe to the vegetables was generally dependent on the particular metal and vegetable species [35].
As shown in Figures 2 and 3, the correlations of Ni and Fe between vegetables and geochemical fractions of the habitat topsoils varied greatly for different vegetable types. This agrees to those reported by Fan et al. [4] and Yang et al. [36]. This was probably due to different absorption mechanism of metals in different types of vegetables [37]. There was no significantly correlation of Fe levels between the vegetables and the F1 fraction of the habitat top soils. It was probably due to other factors such as cation exchange capacity, which could have influenced the Fe availability in the habitat top soils.
Health risk assessments
The values of EDI and THQ of Ni and Fe in the 18 vegetables for adults and children from the present study are presented in Table 10. Overall statistical values of EDI and THQ values for adults and children from the present study are given in Table 11. The EDI values of Ni for adults and children range from 0.08-2.45 and 0.10-2.81, respectively. The EDI values of Fe for adults and children range from 35.3-143 and 40.6-165, respectively. The THQ values of Ni for adults and children range from 0.004-0.120 and 0.038-0.140, respectively. The THQ values of Fe for adults and children range from 0.05-0.20 and 0.06-0.24, respectively. Therefore, all the THQ values in the 18 vegetables for Ni and Fe in both adult and children are all below 1.0. This indicates there are no non-carcinogenic risks of Ni and Fe via the consumption of the 18 vegetables from the present study (Tables 10 and 11).
| Vegetables |
|
EDI |
THQ |
| Ni |
Fe |
Ni |
Fe |
| Momordica charantia (n=6) |
Adults |
0.95 |
55.33 |
0.05 |
0.08 |
| Children |
1.09 |
63.60 |
0.05 |
0.09 |
| Abelmoschus esculentus (n=12) |
Adults |
0.99 |
83.46 |
0.05 |
0.12 |
| Children |
1.13 |
95.94 |
0.06 |
0.14 |
| Cucumis sativus (n=7) |
Adults |
0.52 |
40.42 |
0.03 |
0.06 |
| Children |
0.60 |
46.47 |
0.14 |
0.07 |
| Amaranthus viridis (n=16) |
Adults |
2.45 |
111.21 |
0.12 |
0.16 |
| Children |
2.81 |
127.84 |
0.14 |
0.18 |
| Amaranthus tricolor (n=16) |
Adults |
2.38 |
97.45 |
0.12 |
0.14 |
| Children |
2.73 |
112.02 |
0.05 |
0.16 |
| Benincasa hispida (n=6) |
Adults |
0.89 |
51.22 |
0.04 |
0.07 |
| Children |
1.02 |
58.88 |
0.03 |
0.08 |
| Capsicum annum (n=12) |
Adults |
0.57 |
62.04 |
0.03 |
0.09 |
| Children |
0.66 |
71.31 |
0.03 |
0.10 |
| Lactuca sativa (n=6) |
Adults |
0.51 |
127.62 |
0.03 |
0.18 |
| Children |
0.59 |
146.71 |
0.06 |
0.21 |
| Ipomoea reptans (n=18) |
Adults |
1.06 |
143.20 |
0.05 |
0.20 |
| Children |
1.22 |
164.62 |
0.06 |
0.24 |
| Solanum melongena (n=6) |
Adults |
1.09 |
56.14 |
0.05 |
0.08 |
| Children |
1.25 |
64.53 |
0.05 |
0.09 |
| Brassica rapa (n=8) |
Adults |
0.93 |
123.10 |
0.05 |
0.18 |
| Children |
1.07 |
141.51 |
0.04 |
0.20 |
| Allium tuborosum (n=22) |
Adults |
0.77 |
89.78 |
0.04 |
0.13 |
| Children |
0.88 |
103.20 |
0.04 |
0.15 |
| Momordica charantia L. (n=6) |
Adults |
0.08 |
51.57 |
0.004 |
0.07 |
| Children |
0.10 |
59.28 |
0.02 |
0.08 |
| Vigna sinesis (n=16) |
Adults |
0.32 |
54.40 |
0.02 |
0.08 |
| Children |
0.37 |
62.54 |
0.04 |
0.09 |
| Lagenaria siceraria (n=6) |
Adults |
0.72 |
67.23 |
0.04 |
0.10 |
| Children |
0.82 |
77.29 |
0.01 |
0.11 |
| Luffa acutangula (n=6) |
Adults |
0.22 |
41.47 |
0.01 |
0.06 |
| Children |
0.26 |
47.68 |
0.03 |
0.07 |
| Tricosanthes celebica (n=6) |
Adults |
0.53 |
35.28 |
0.03 |
0.05 |
| Children |
0.61 |
40.55 |
0.03 |
0.06 |
| Cucurbita moschata (n=5) |
Adults |
0.45 |
45.94 |
0.02 |
0.07 |
| Children |
0.51 |
52.82 |
0.03 |
0.08 |
* Daily consumption for adults is 345 and 232 for children (g/day) and average body weight 55.90 kg and 32.70 kg for adults and children, respectively [5]
Table 10: Estimated daily intake (EDI) and target hazard quotient (THQ) values of Ni and Fe in the 18 vegetables for adults and children from the present study.
| |
EDI |
THQ |
| Adults |
Ni |
Fe |
Ni |
Fe |
| Minimum |
0.08 |
35.28 |
0.004 |
0.05 |
| Maximum |
2.45 |
143.20 |
0.120 |
0.20 |
| Mean |
0.86 |
74.27 |
0.043 |
0.11 |
| Standard deviation |
0.64 |
33.50 |
0.031 |
0.05 |
| Standard error |
0.15 |
7.90 |
0.007 |
0.01 |
| Children |
Ni |
Fe |
Ni |
Fe |
| Minimum |
0.10 |
40.55 |
0.038 |
0.06 |
| Maximum |
2.81 |
164.62 |
0.140 |
0.24 |
| Mean |
0.98 |
85.38 |
0.048 |
0.12 |
| Standard deviation |
0.73 |
38.51 |
0.037 |
0.06 |
| Standard error |
0.17 |
9.08 |
0.009 |
0.01 |
Table 11: Overall statistics of estimated daily intake (EDI) and target hazard quotient (THQ) values of Ni and Fe for adults and children from the present study.
Based on a study by Qureshi et al. [30], the highest Fe contribution to the consumer intake came from lettuce, which was 10 times higher than all other vegetables. From Tables 6 and 7, the highest level of Fe was also found in lettuce (Lactuca sativa), indicating its capacity to accumulate Fe. However, the Fe THQ for L. sativa was below 1.0. Therefore, the consumption of lettuce will not induce any adverse health (non-carcinogenic) effects arising largely from Fe exposure.
Conclusion
From the present study, the levels of Ni and Fe are all lower in the fruit vegetables than those in the leafy vegetables. It is found that the Ni levels in the vegetables are highly correlated with the three geochemical and NR fractions of the habitat top soils. The Fe levels in the vegetables are highly correlated with the ‘acid-reducible’ fraction of the habitat top soils. The positive relationships indicated the potential of edible vegetables as good biomonitors of Ni pollution in the habitat top soils. For the health risk assessment, al the THQ values for Ni and Fe in the 18 vegetables investigated in both adult and children are all below 1.00. This indicated that there was no non-carcinogenic risk of Ni and Fe to the consumers for both adults and children. Nevertheless, regular monitoring and management of the vegetable farms is still needed.
Acknowledgement
The authors wish to acknowledge the partial financial support provided through the Fundamental Research Grant Scheme (FRGS), [Vote no.: 5524953], by Ministry of Higher Education, Malaysia.
References
- Jan FA, Ishaq M, Khan S, Ihsanullah I, Ahmad I, et al. (2010) A comparative study of human health risks via consumption of food crops grown on wastewater irrigated soil (Peshawar) and relatively clean water irrigated soil (lower Dir). J Hazard Mater 179: 612-621.
- Lawal NS, Agbo O, Usman A (2017) Health risk assessment of heavy metals in soil, irrigation water and vegetables grown around Kubanni River, Nigeria. J Phys Sci 28: 49-59.
- Omolo OJ, Chhabra SC, Nyagah G (2001) Iron content of some edible leafy vegetables and medicinal plants used traditionally for anaemia treatment in East Africa. Afr J Health Sci 8: 55-60.
- Fan Y, Li H, Xue Z, Zhang Q, Cheng F (2017) Accumulation characteristics and potential risk of heavy metals in soil-vegetable system under greenhouse cultivation condition in Northern China. Ecol Eng 102: 367-373.
- Wang X, Sato T, Xing B, Tao S (2005) Health risks of heavy metals to the general public in Tianjin, China via consumption of vegetables and fish. Sci Tot Environ 350: 28-37.
- Khan S, Cao Q, Zheng YM, Huang YZ, Zhu YG (2008) Health risks of heavy metals in contaminated soils and food crops irrigated with wastewater in Beijing, China. Environ Pollut 152: 686-692.
- Islam MS, Ahmed MK, Habibullah-Al-Mamun M (2016) Apportionment of heavy metals in soil and vegetables and associated health risks assessment. Stochastic Environ Res Risk Assess 30: 365-377.
- Chang CY, Yu HY, Chen JJ, Li FB, Zhang HH, et al. (2014) Accumulation of heavy metals in leaf vegetables from agricultural soils and associated potential health risks in the Pearl River Delta, South China. Environ Monit Assess 186: 1547-1560.
- Garg VK, Yadav P, Mor S, Singh B, Pulhani V (2014) Heavy metals bioconcentration from soil to vegetables and assessment of health risk caused by their ingestion. Biol Trace Element Res 157: 256-265.
- Lion GN, Olowoyo JO (2013) Population health risk due to dietary intake of toxic heavy metals from Spinacia oleracea harvested from soils collected in and around Tshwane, South Africa. South Afr J Bot 88: 178-182.
- Xue ZJ, Liu SQ, Liu YL, Yan YL (2012) Health risk assessment of heavy metals for edible parts of vegetables grown in sewage-irrigated soils in suburbs of Baoding City, China. Environ Monit Assess 184: 3503-3513.
- Bian B, Wu H, Lv L, Fan Y, Lu H (2015) Health risk assessment of metals in food crops and related soils amended with biogas slurry in Taihu Basin: Perspective from field experiment. Environ Sci Pollut Res 22: 14358-14366.
- Zhang C, Wang Y, Zhang Z, Wang D, Luo C, et al. (2015) Health risk assessment of heavy metals and as in vegetable and soil system in Chongqing, Southwest of China. J Resid Sci Tech 12: 231-240.
- Islam MS, Ahmed MK, Habibullah-Al-Mamun M, Masunaga S (2014) Trace metals in soil and vegetables and associated health risk assessment. Environ Monit Assess 186: 8727-8739.
- Zhang H, Huang B, Dong L, Hu W, Akhtar MS, et al. (2017) Accumulation, sources and health risks of trace metals in elevated geochemical background soils used for greenhouse vegetable production in southwestern China. Ecotox Environ Saf 137: 233-239.
- Chin HF, Yap EE (1999) Malaysian vegetables in colour: A complete guide. Kuala Lumpur: Tropical Press.
- Prohens J, Nuez F (2008a) Vegetables I: Asteraceae, Brassicaceae, Chenopodicaceae and Cucurbitaceae. New York: Springer.
- Prohens J, Nuez F (2008b) Vegetables II:Fabaceae, Liliaceae, Solanaceae and Umbelliferae. New York: Springer.
- Badri MA, Aston SR (1983) Observation on heavy metal geochemical associations in polluted and non-polluted estuarine sediments. Environ Pollut Ser 6: 181-193.
- USEPA (2000) Risk-based concentration table. United State Environmental Protection Agency, Washington, DC.
- USEPA (2015) Human health risk assessment. Regional screening level (RSL)-summary table.
- Li Q, Chen Y, Fu H, Cui Z, Shi L, et al. (2012) Health risk of heavy metals in food crops grown on reclaimed tidal flat soil in the Pearl River Estuary, China. J Hazard Mater 227: 148-154.
- Jolly YN, Islam A, Akbar S (2013) Transfer of metals from soil to vegetables and possible health risk assessment. Springer Plus 2: 385.
- Yang LQ, Huang B, Hu WY, Chen Y, Mao MC, et al. (2014) The impact of greenhouse vegetable farming duration and soil types on phytoavailability of heavy metals and their health risk in eastern China. Chemosphere 103: 121-130.
- Yap CK, Ismail A, Tan SG, Omar H (2002) Correlations between speciation of Cd, Cu, Pb and Zn in sediment and their concentrations in total soft tissue of green-lipped mussel Perna viridis from the West Coast of Peninsular Malaysia. Environ Int 28: 117-126.
- Peris M, Micó C, Recatalá L, Sánchez R, Sánchez J (2007) Heavy metal contents in horticultural crops of a representative area of the European Mediterranean region. Sci Tot Environ 378: 42-48.
- Xu L, Lu AX, Wang JH, Ma ZH, Pan LG, et al. (2015) Accumulation status, sources and phytoavailability of metals in greenhouse vegetable production systems in Beijing, China. Ecotox Environ Saf 122: 214-220.
- Sun FF, Wang FH, Wang X, He W, Wen DA, et al. (2013) Soil threshold values of total and available cadmium for vegetable growing based on field data in Guangdong province, South China. J Sci Food Agr 93: 1967-1973.
- Cui YJ, Zhu YG, Zhai RH, Chen DY, Huang YZ, et al. (2004) Transfer of metals from soil to vegetables in an area near a smelter in Nanning, China. Environ Int 30: 785-791.
- Qureshi AS, Hussain MI, Ismail S, Khan QM (2016) Evaluating heavy metal accumulation and potential health risks in vegetables irrigated with treated wastewater. Chemosphere 163: 54-61.
- Liu HY, Probst A, Liao BH (2005) Metal contamination of soils and crops affected by the Chenzhou lead zinc mine spill (Hunan, China). Sci Total Environ 339: 153-166.
- Gu JG, Lin QQ, Hu R, Zhuge YP, Zhou QX (2005) Translocation behavior of heavy metals in soily plant system: A case study from Qingchengzi lead-zinc mine in Liaoning Province. J Agro-Environ Sci 24: 634-637.
- Adamo P, Lavazzo P, Albanese S, Agrelli D, De-Vivo B, et al. (2014) Bioavailability and soil-to-plant transfer factors as indicators of potentially toxic element contamination in agricultural soils. Sci Tot Environ 500: 11-22.
- Liu X, Song Q, Tang Y, Li W, Xu J, et al. (2013) Human health risk assessment of heavy metals in soil-vegetable system: A multi-medium analysis. Sci Tot Environ 464: 530-540.
- Xu D, Zhou P, Zhan J, Gao Y, Dou C, et al. (2013) Assessment of trace metal bioavailability in garden soils and health risks via consumption of vegetables in the vicinity of Tongling mining area, China. Ecotox Environ Saf 90: 103-111.
- Yang H, Liang QL, Zhao L, Zhu C (2012) The cumulative effect on heavy metal of seven kinds of vegetable crops and effects on heavy metal absorption of intercropping Kummerowia striata. J Soil Water Conserv 26: 209-214.
- Khan A, Khan S, Khan MA, Qamar Z, Waqas M (2015) The uptake and bioaccumulation of heavy metals by food plants, their effects on plants nutrients and associated health risk: A review. Environ Sci Pollut Res 22: 13772-13799.